The client · the interface

The whole interface,screen by screen.

Six screens, a page per fortress, and two themes — annotated. Every screen shows the demonstration dataset: a device signed into two example companies, Orange Corp and Nordbank, and one personal space. Names aside, this is the interface as it runs.

01This device

Overview

The landing screen answers the whole question at once: how many folders are watched, how many sessions exist, where they go, and whether everything has arrived. Every figure links to its proof — and anything that needs a human decision arrives as a banner, like the repository below that no project has claimed.
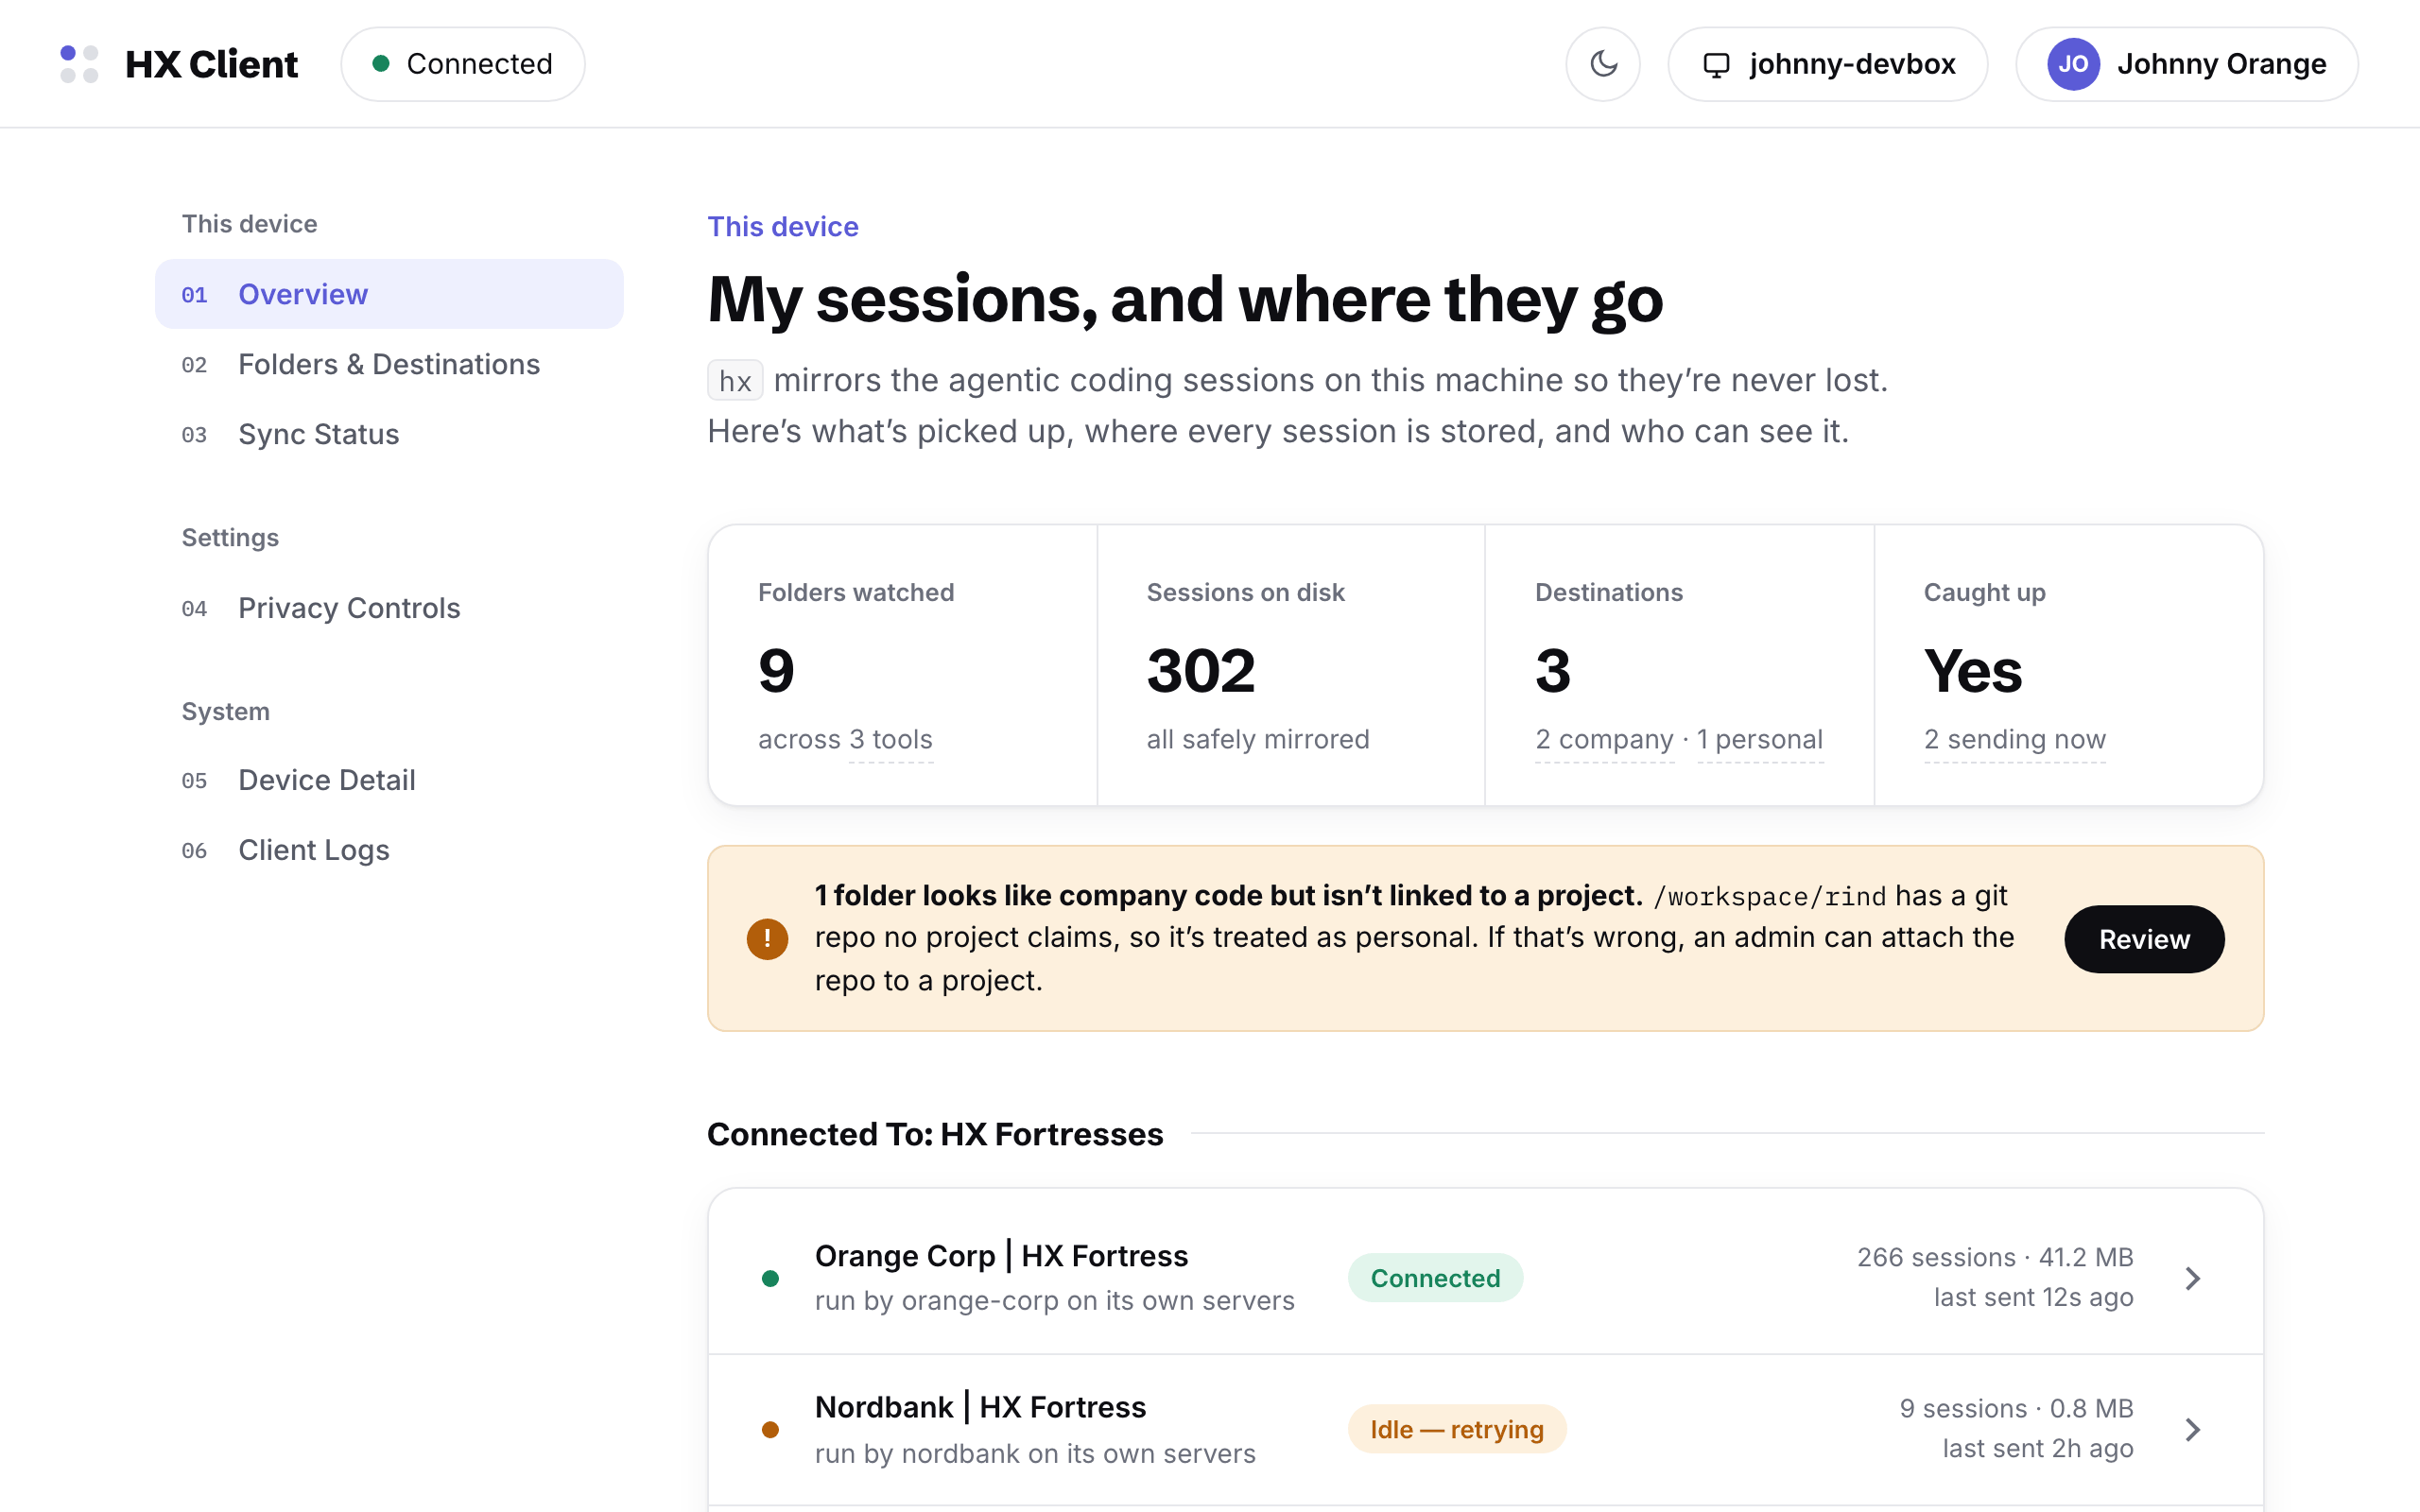
HX Client overview: stat cards for folders watched, sessions on disk, destinations and caught-up state; a review banner; the list of connected HX Fortresses
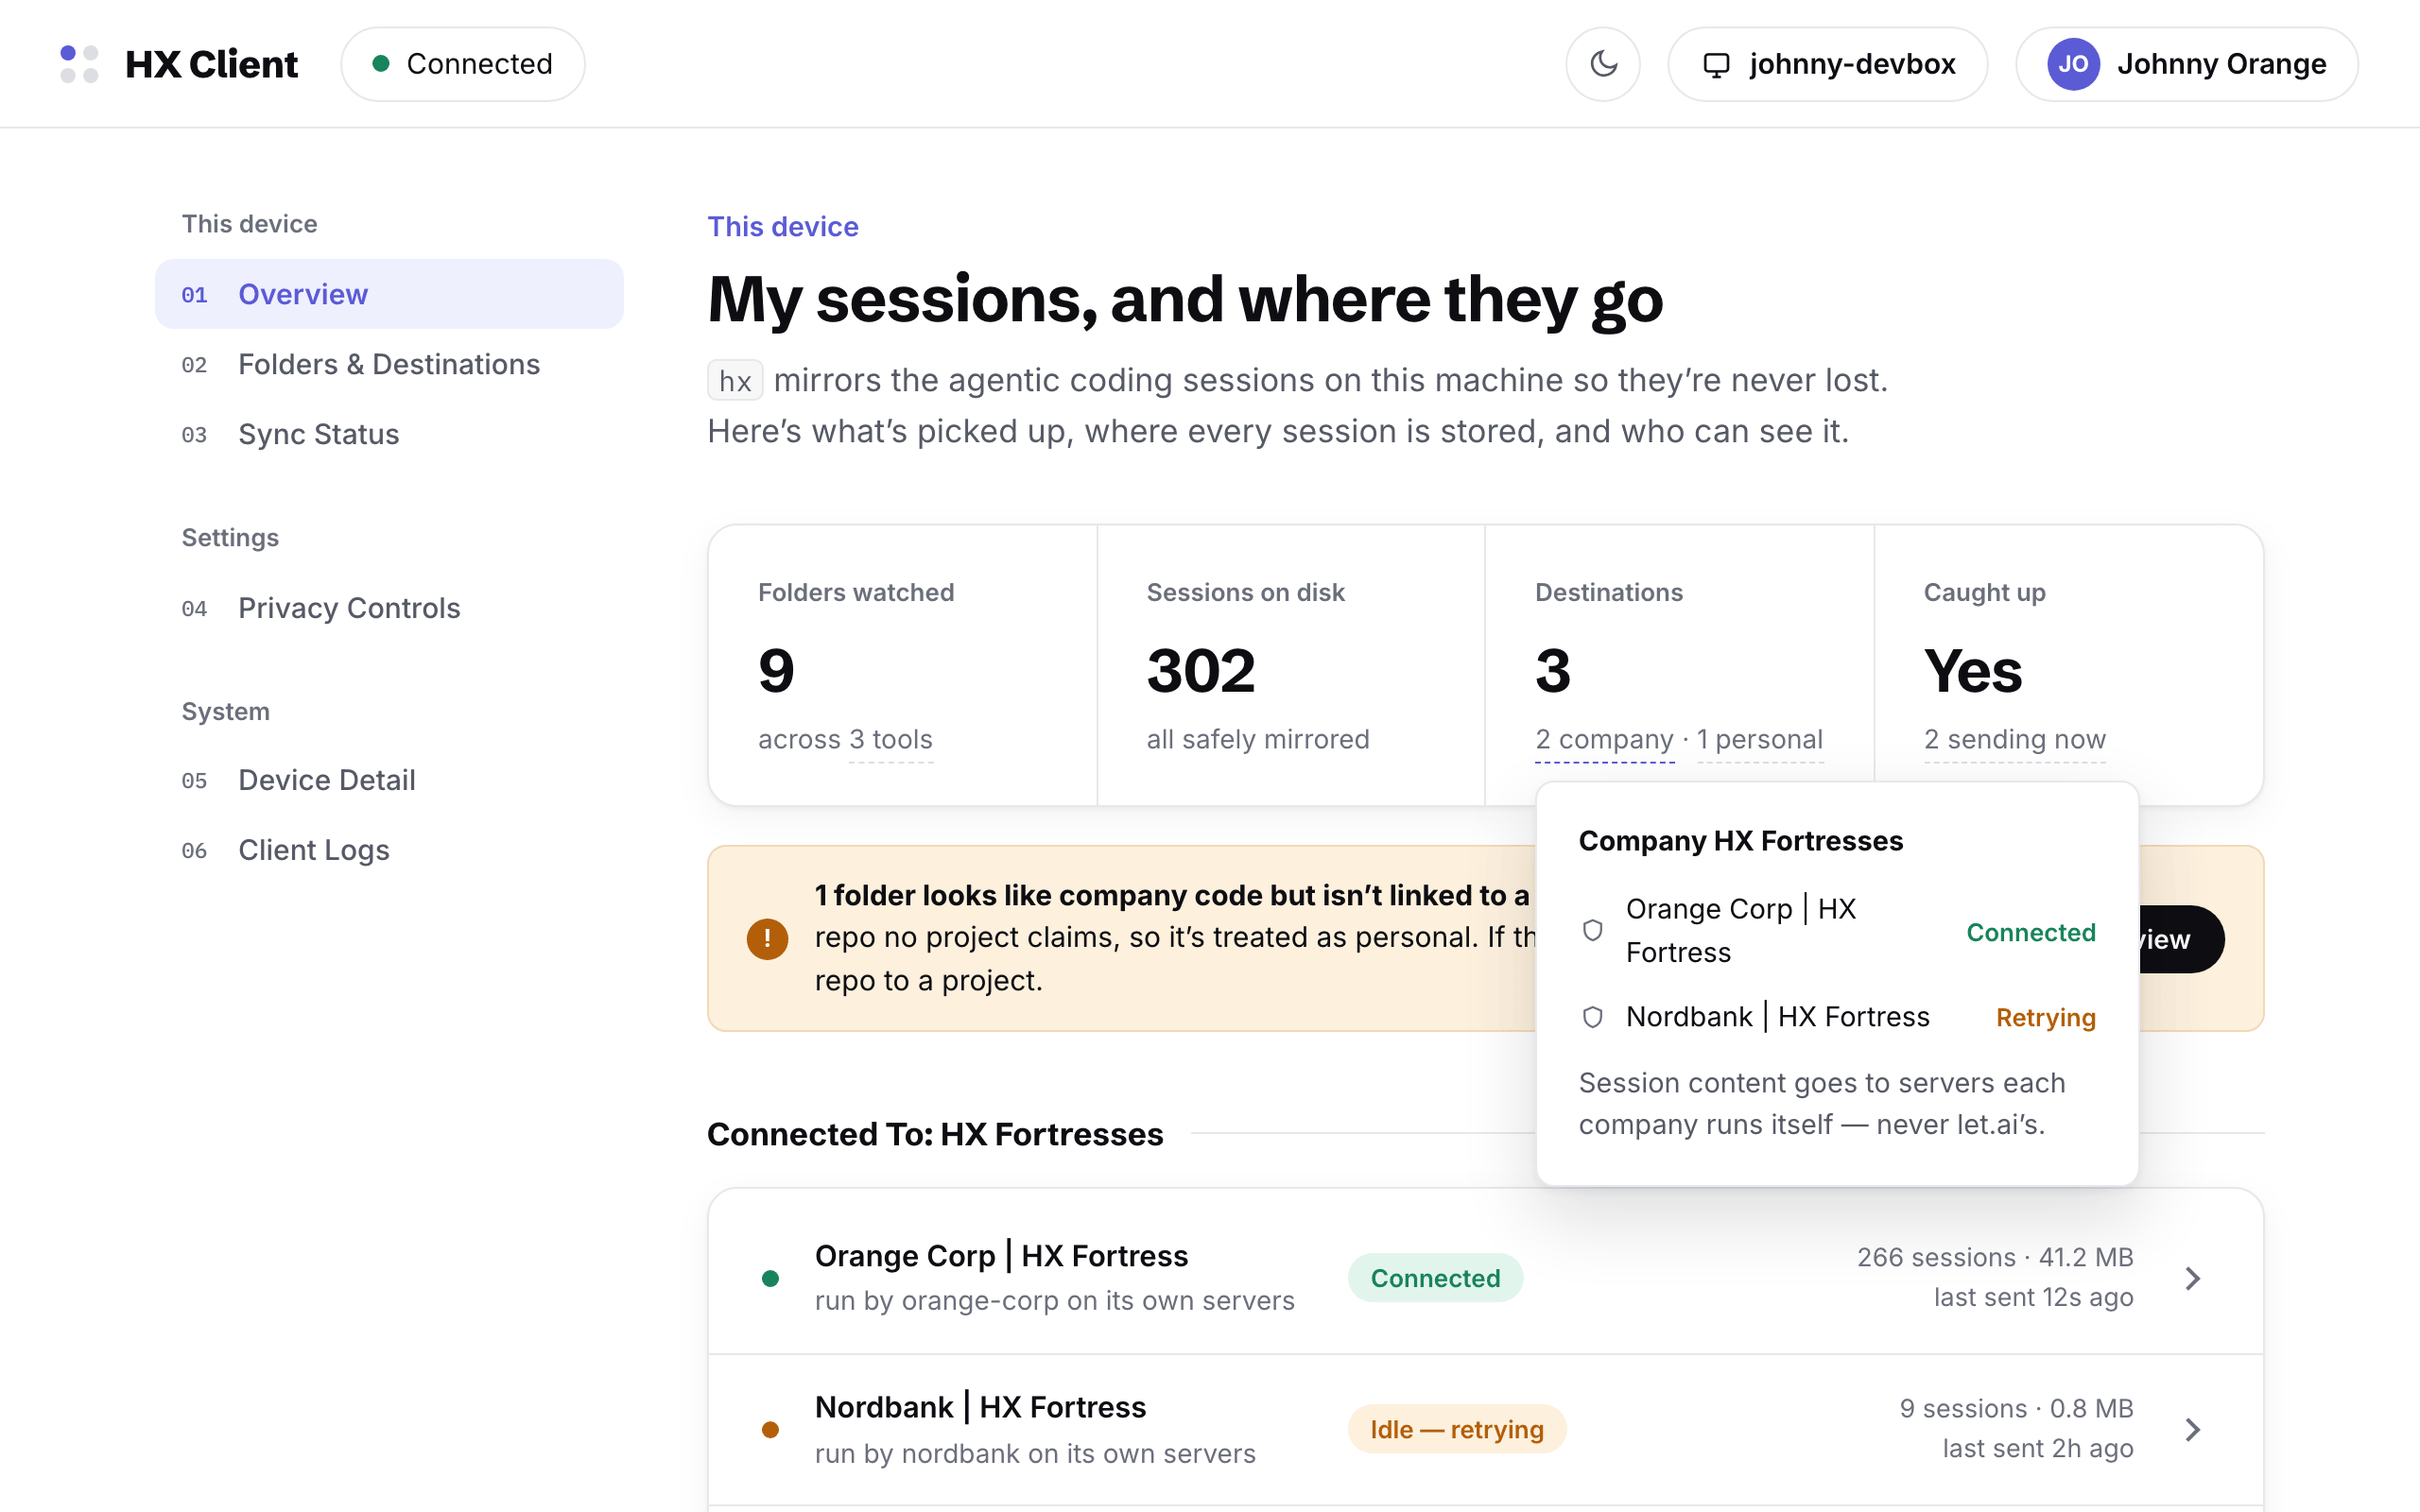
The destinations stat expanded into a hover card listing the two company fortresses with their connection state
Hovering a figure explains it. Company session content goes to servers each company runs itself.
02This device

Folders & Destinations

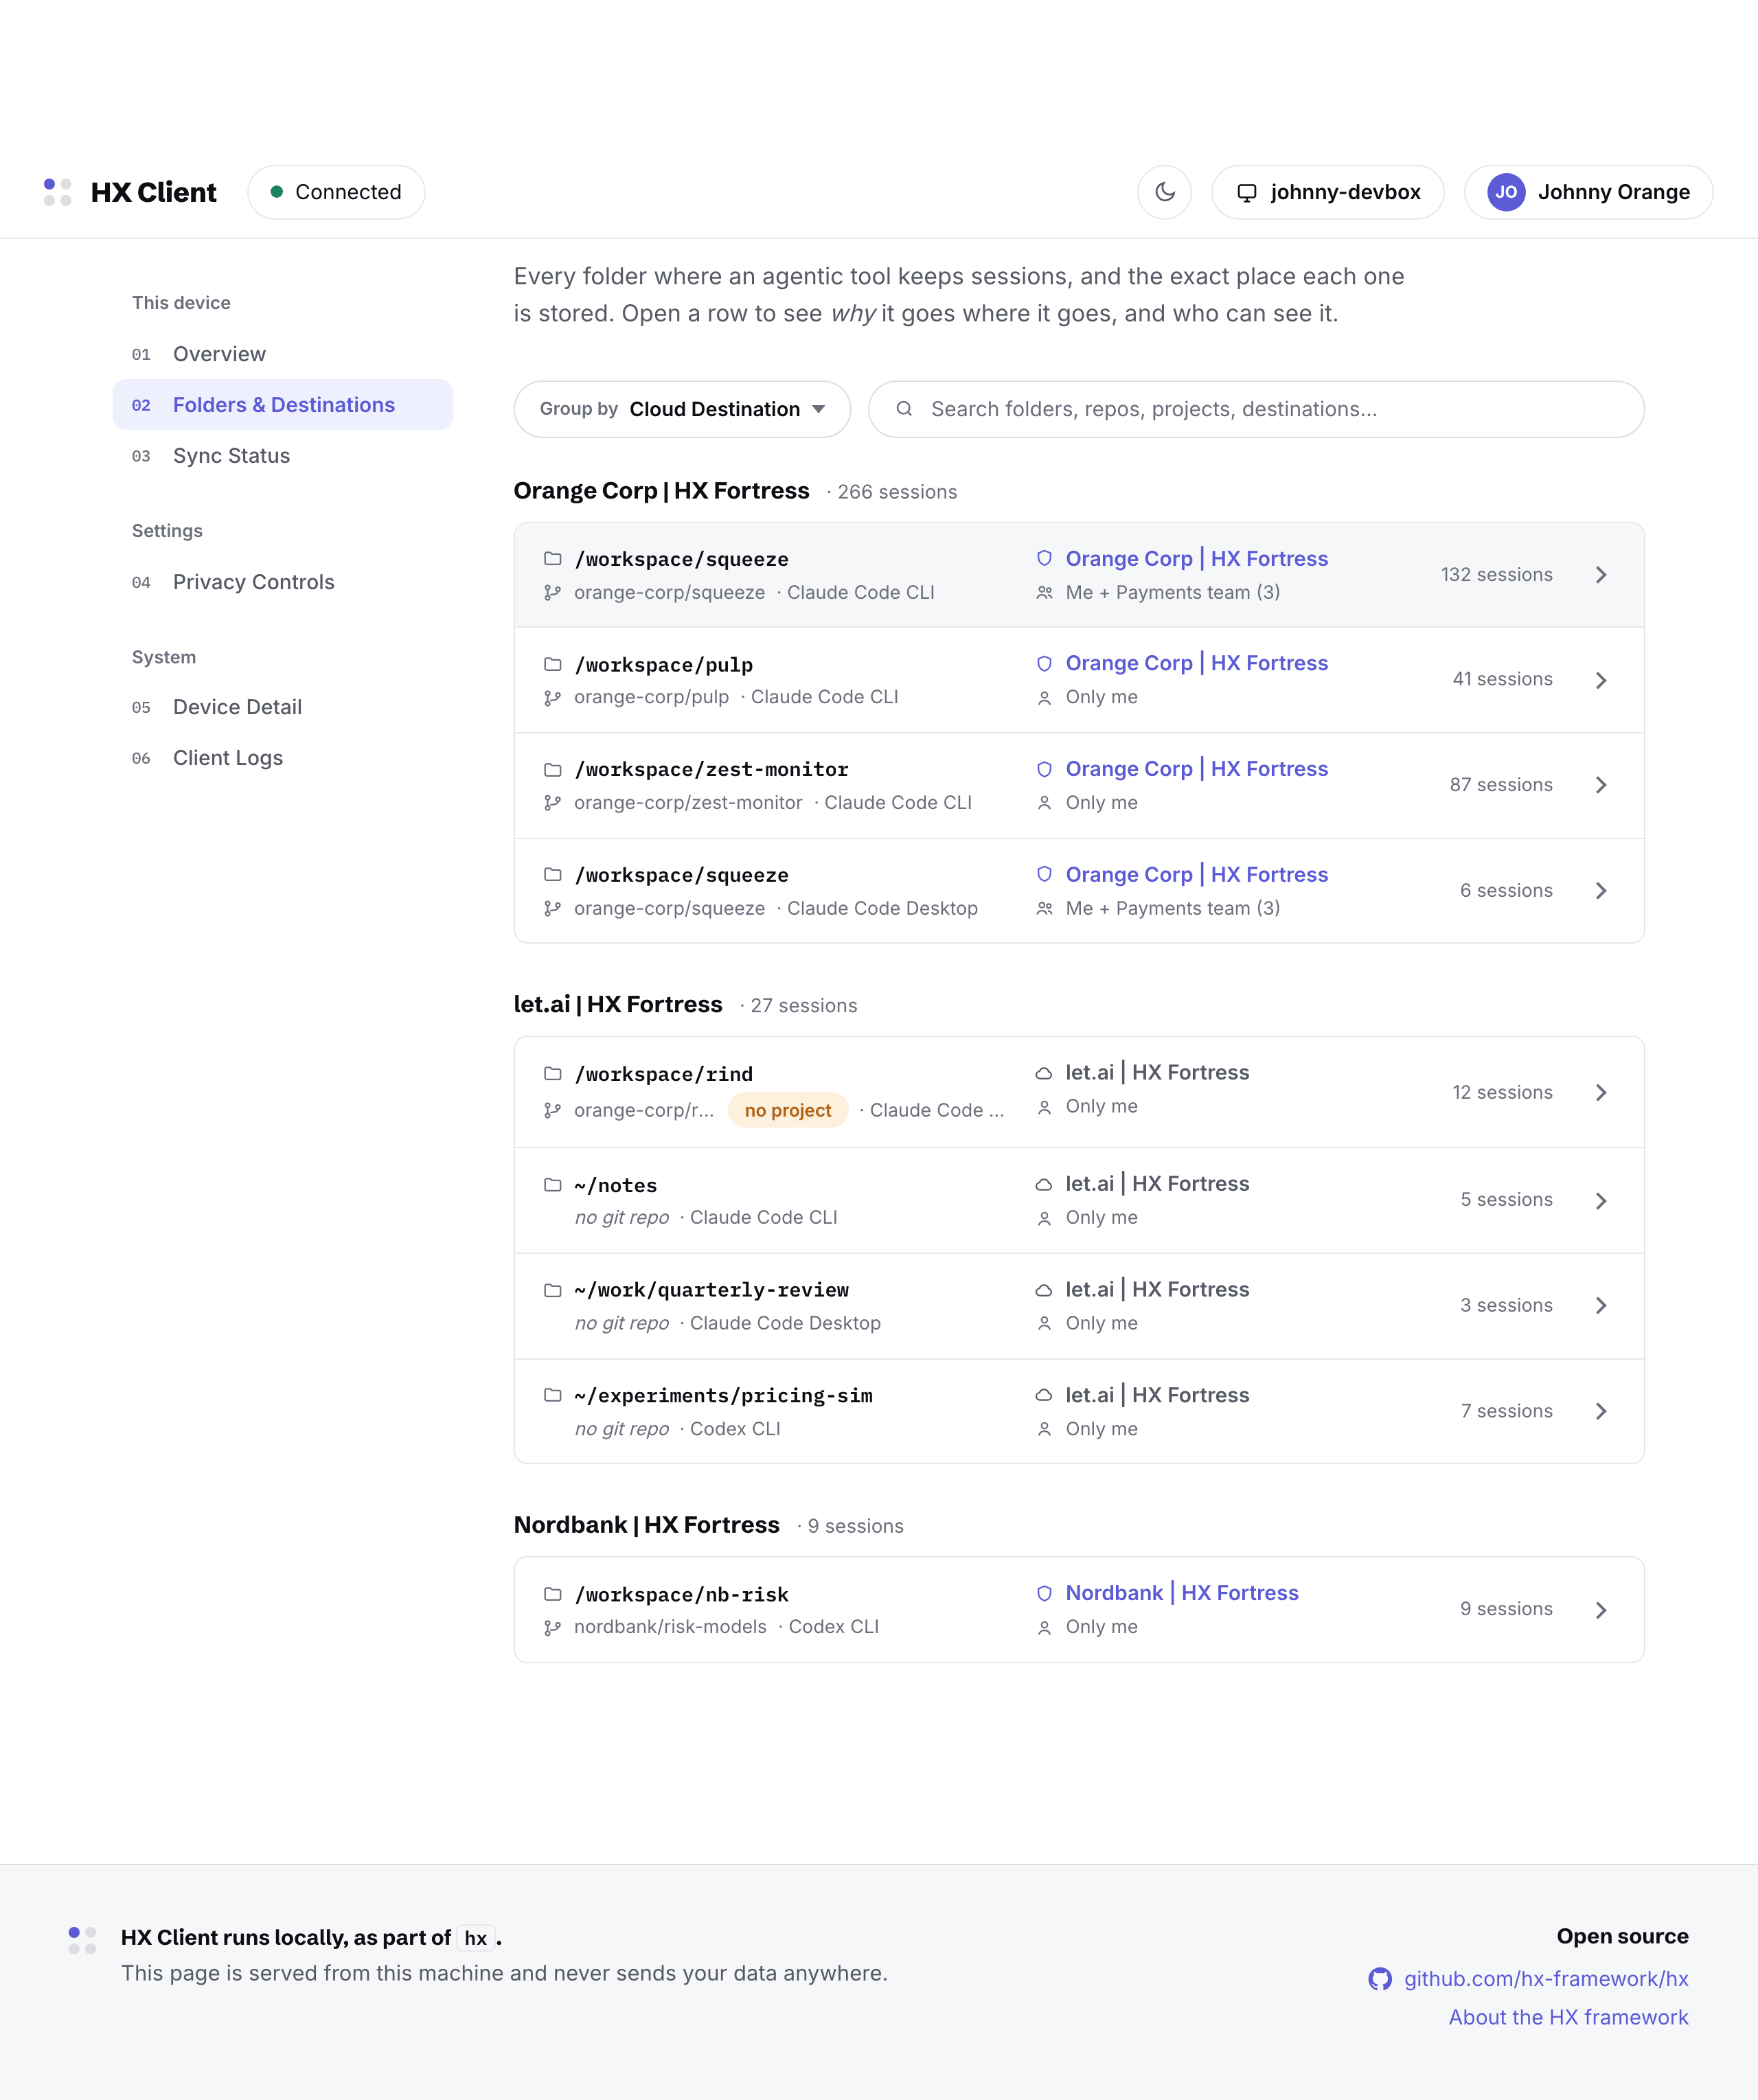
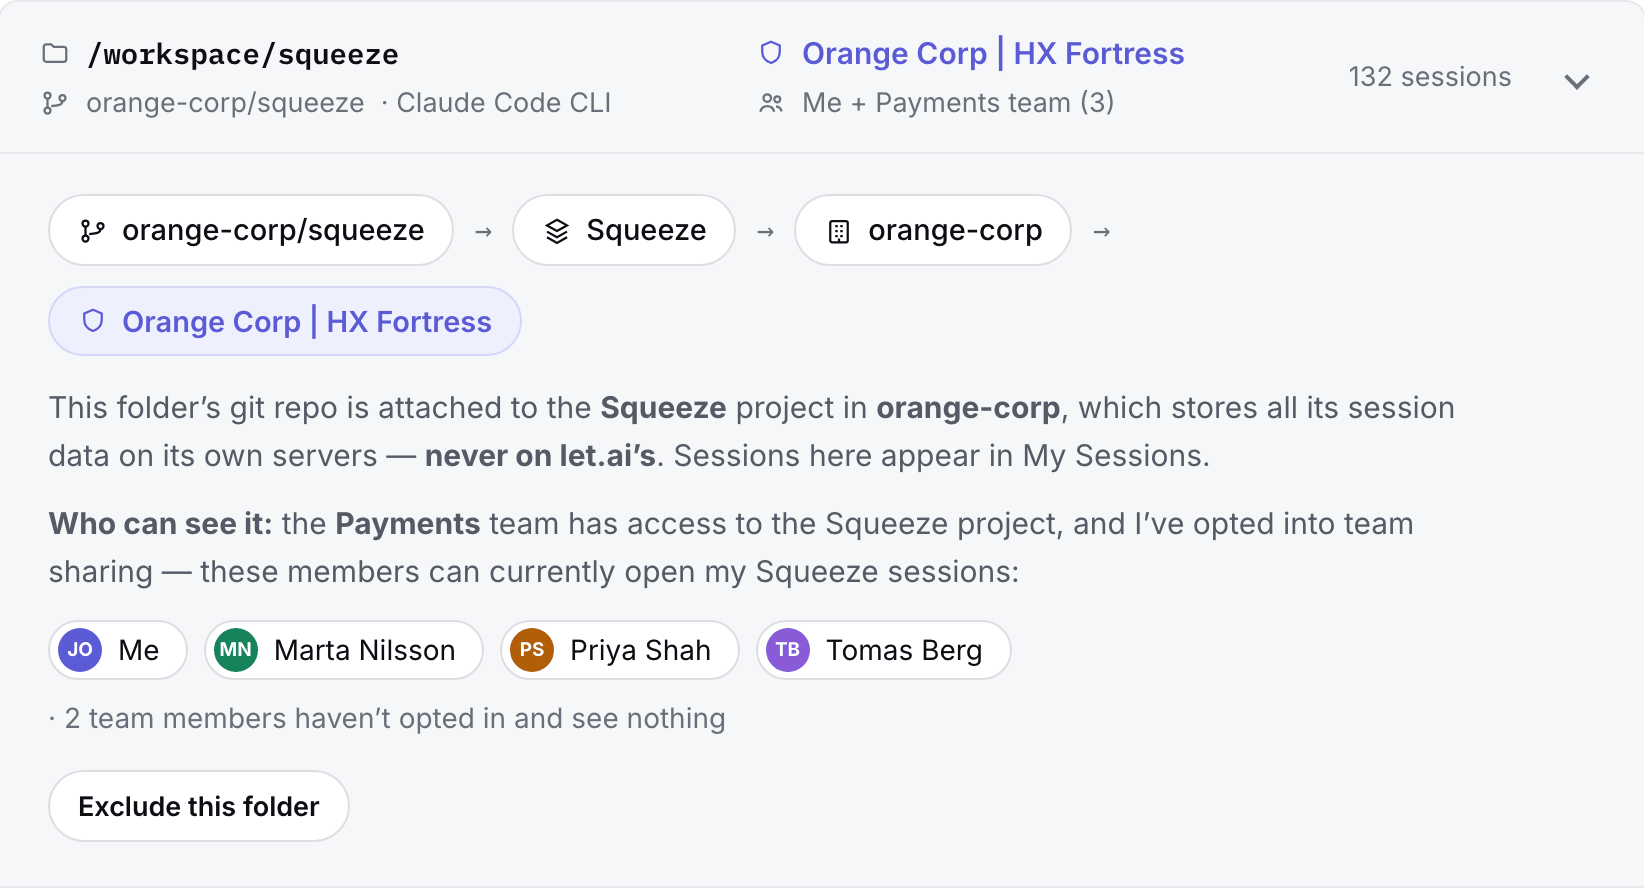
Every folder an agent tool keeps sessions in, and the exact place each one is stored. A row opens into the why: the chain from repository to fortress, and the people who can see the sessions — by name.
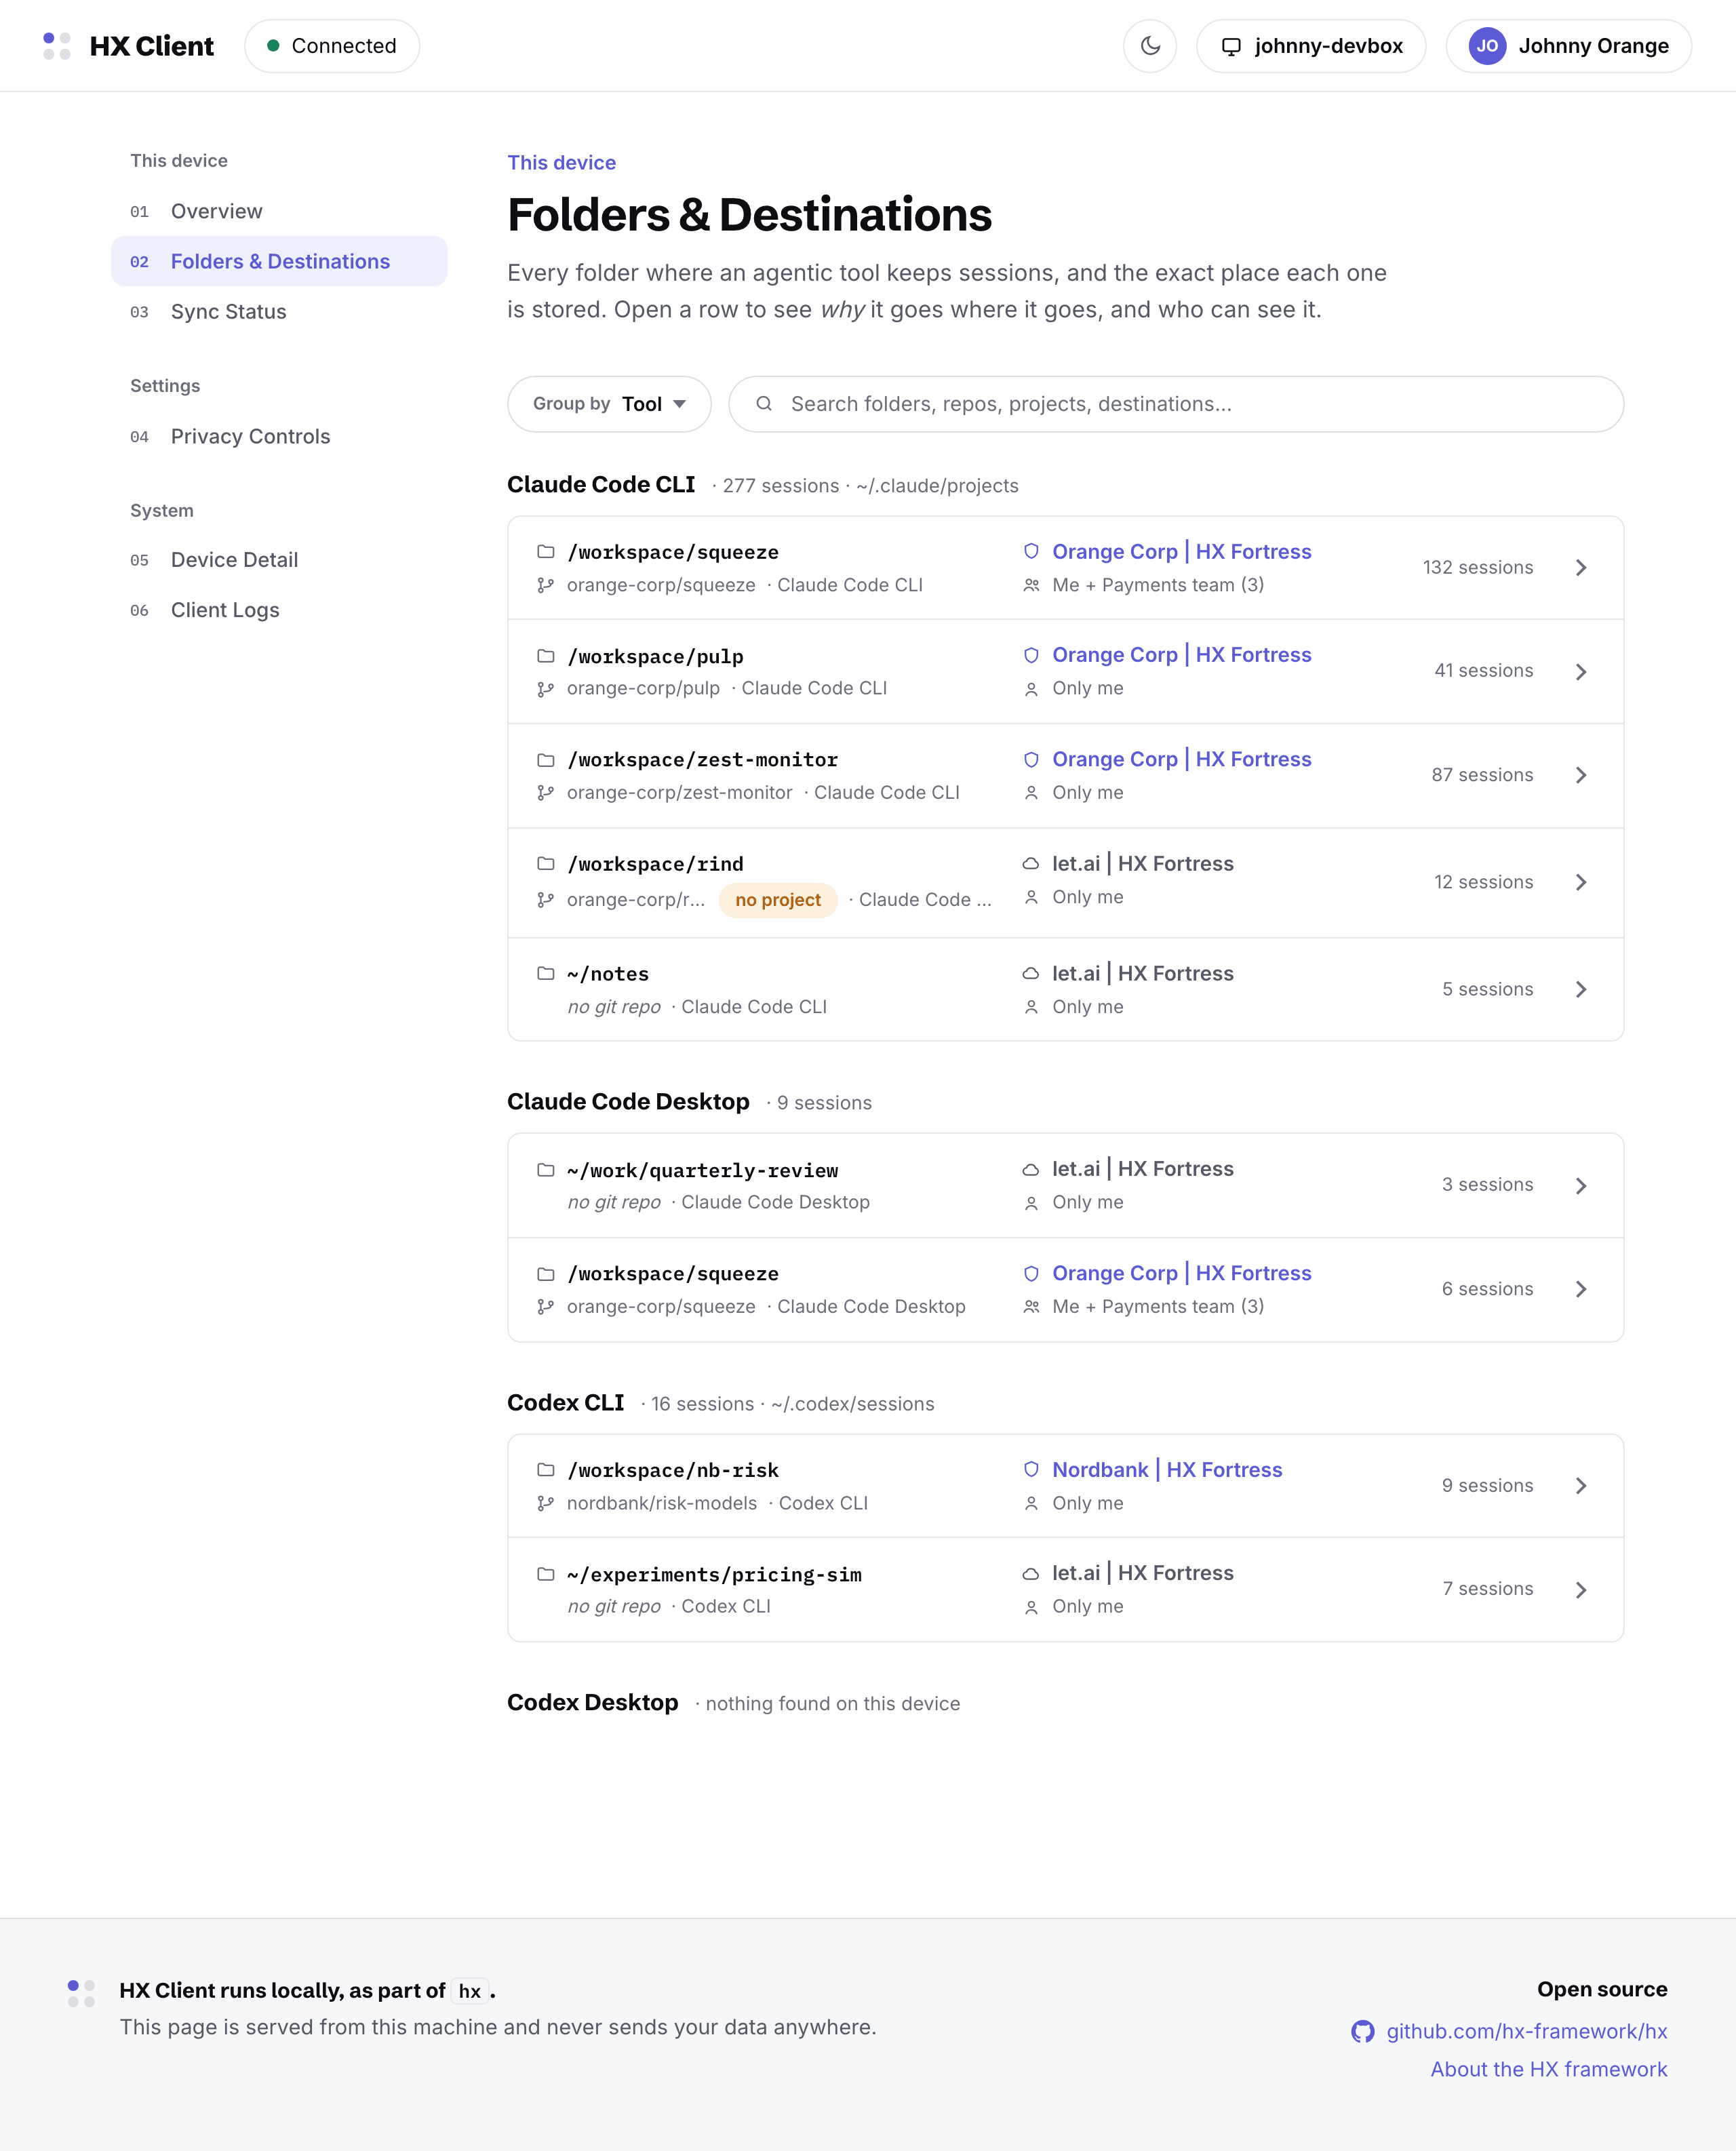
Folders & Destinations: watched folders grouped by tool — Claude Code CLI, Claude Code Desktop, Codex CLI — each with its destination and visibility
An expanded company folder: routing chain repository → project → company → fortress, and the named teammates who can open these sessions
A company folder: the routing chain, then the audience — named people, each there by their own opt-in.
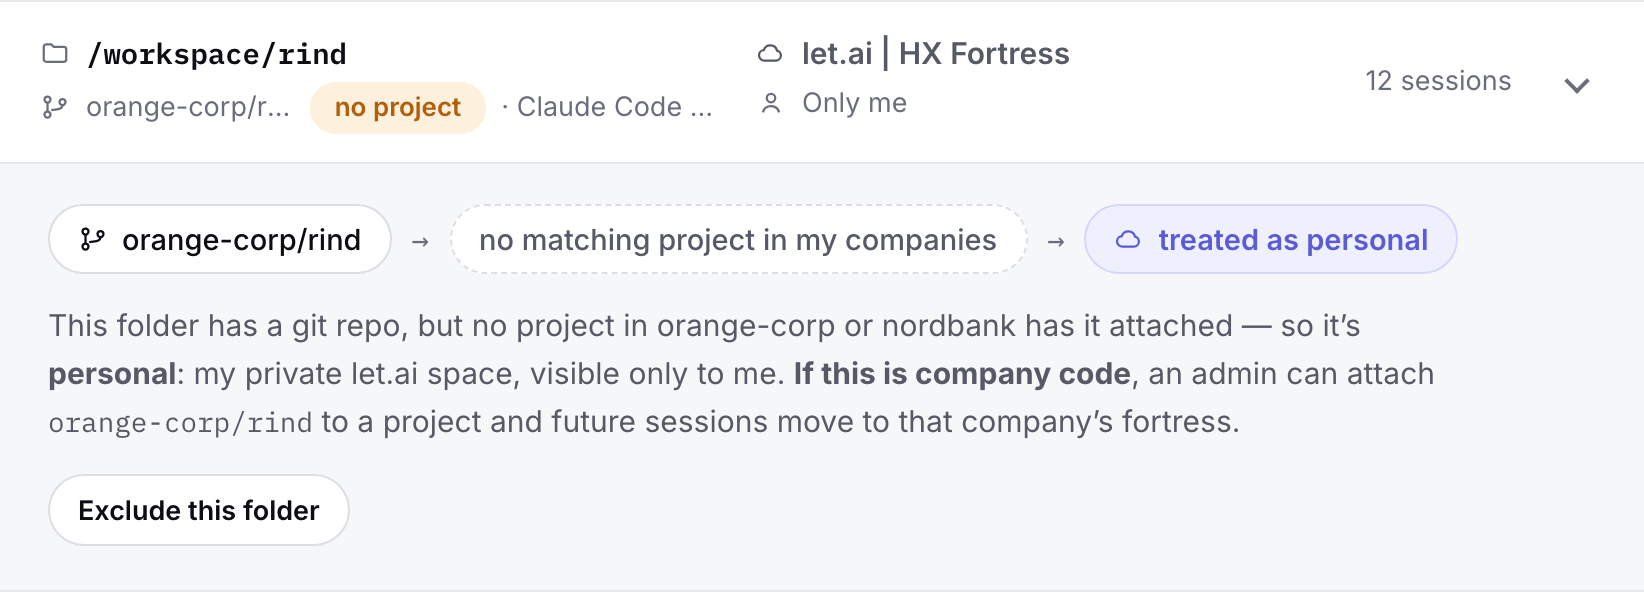
An expanded unlinked folder: a git repository no project has claimed, treated as personal until an administrator attaches it
A repository no project has claimed is treated as personal — and flagged, so the routing gets decided by a person.
The same folder list regrouped by cloud destination, one group per fortress
The same list, regrouped by destination: one group per fortress, so the data-residency picture reads at a glance.
03This device

Sync Status

What is uploading right now, what waits in queue, and what already left — one stream, newest first, with sizes and destinations on every row.
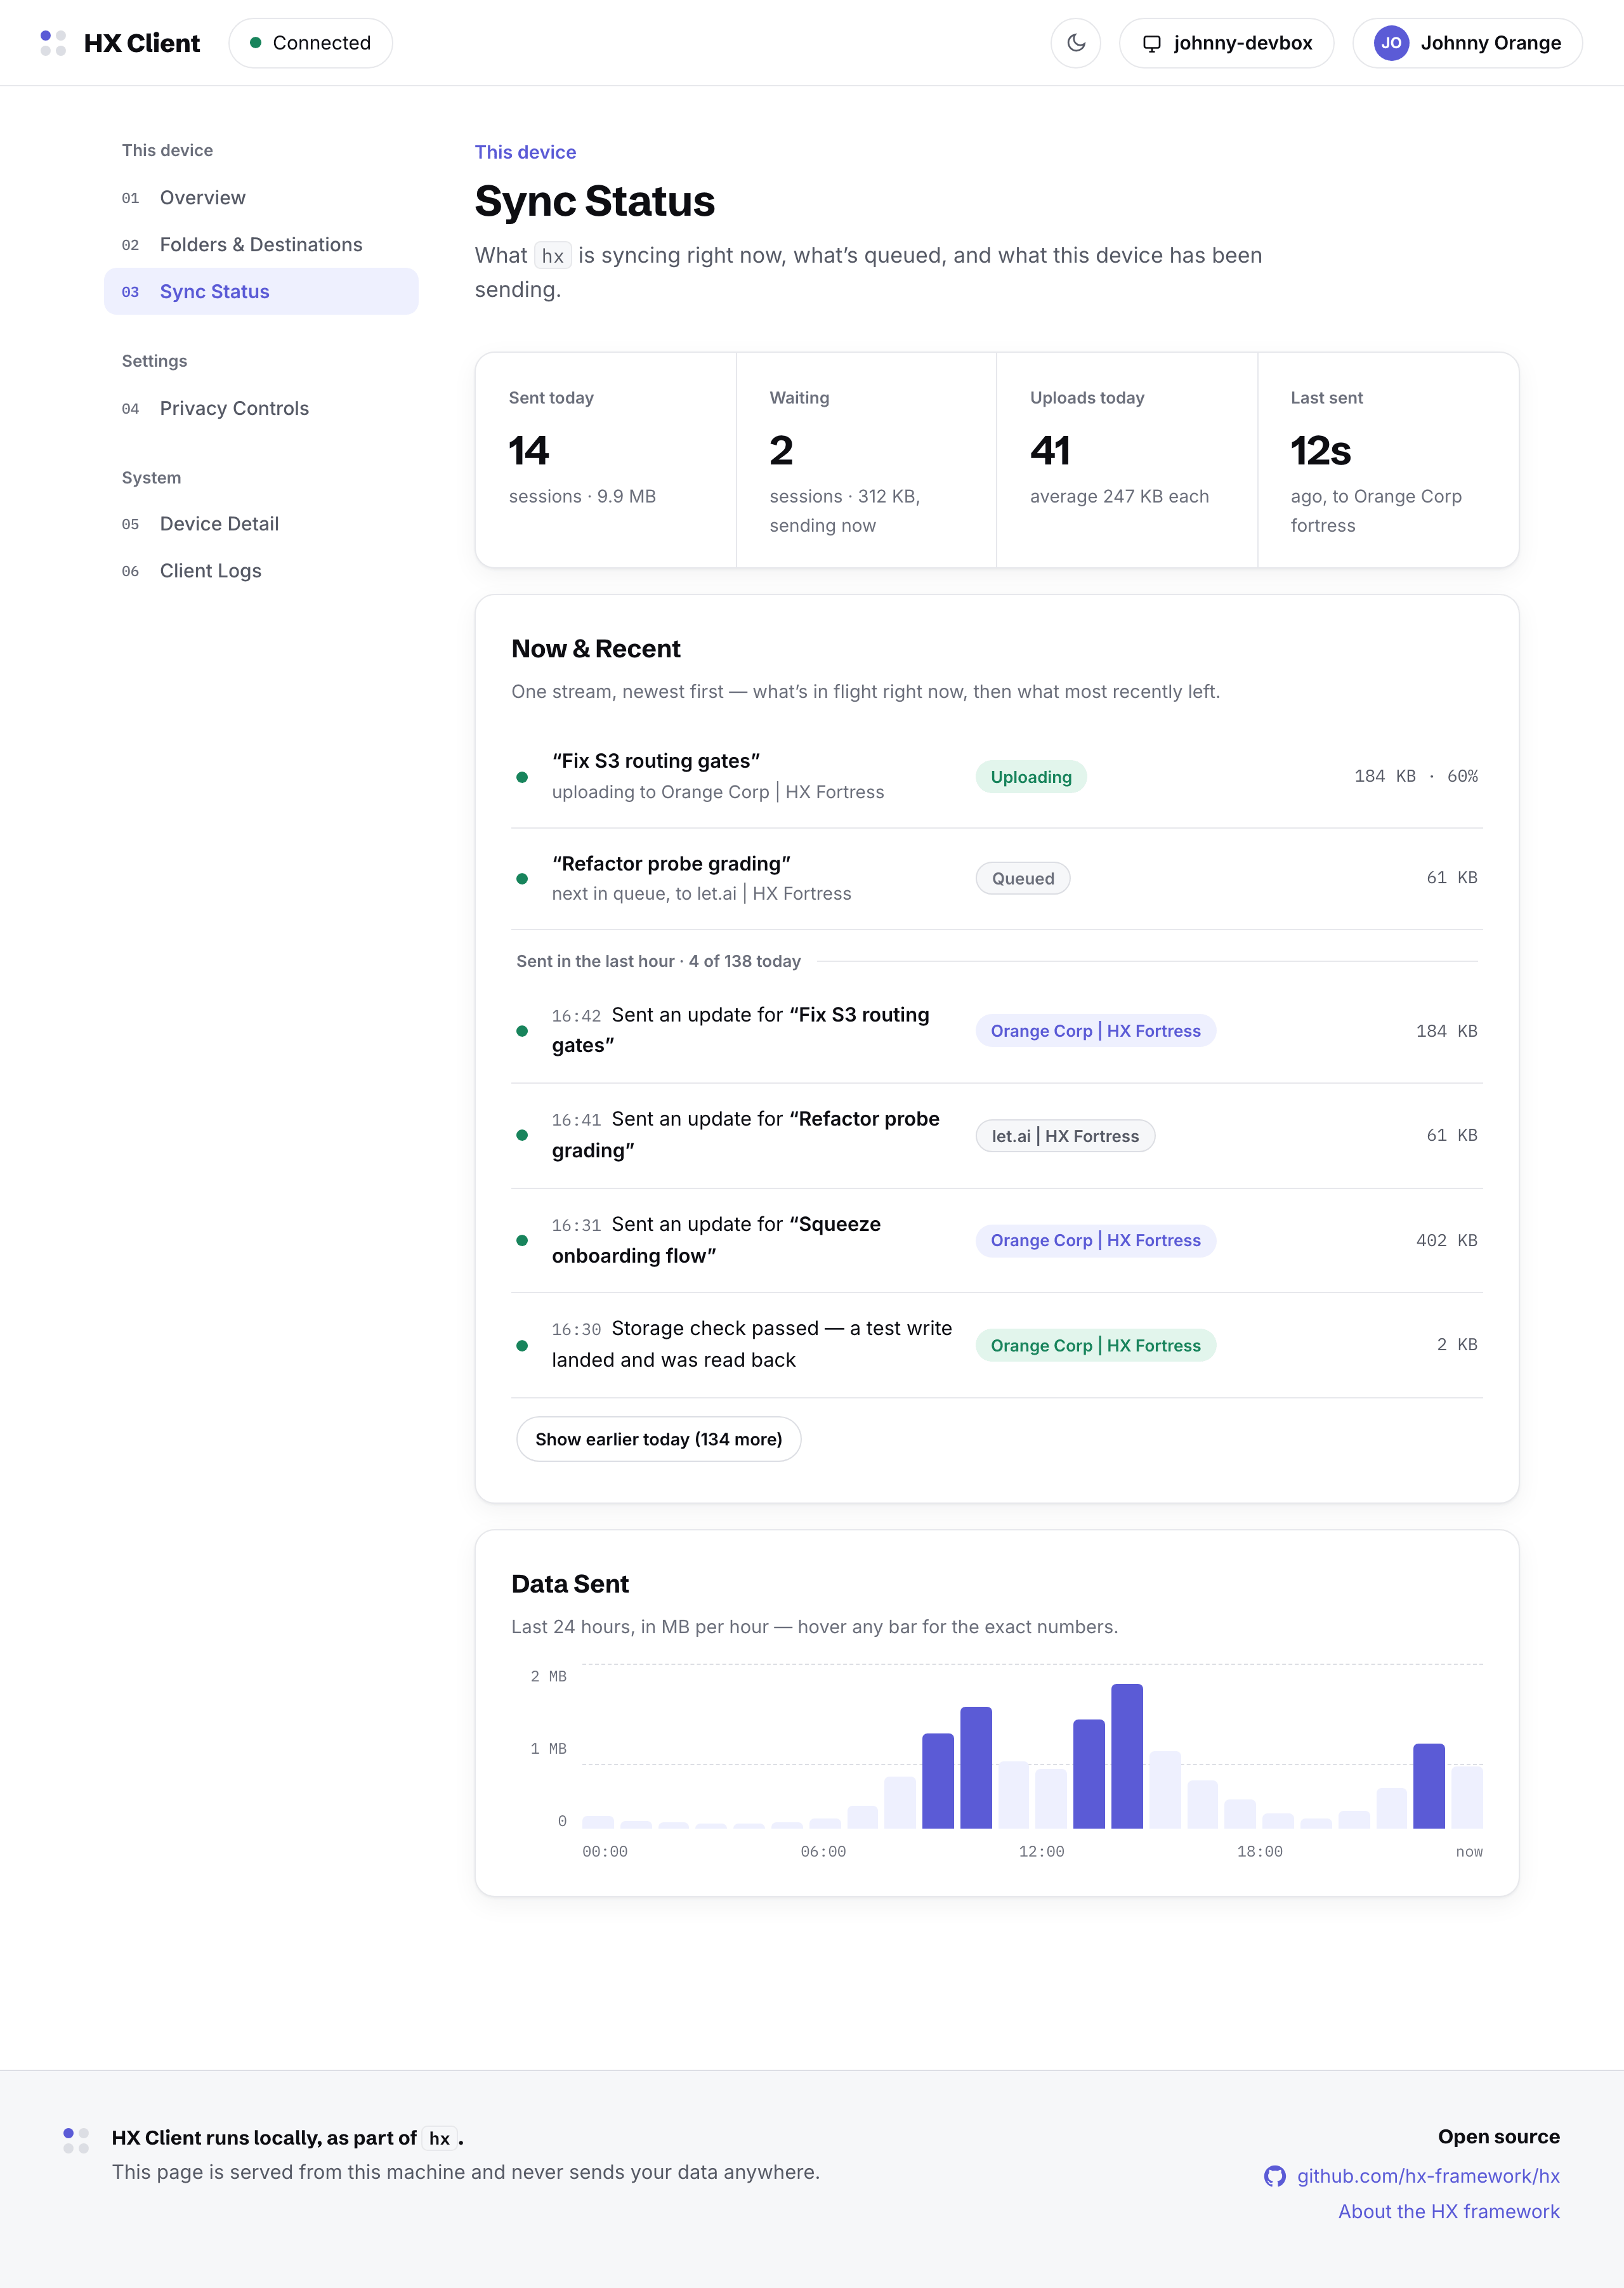
Sync Status: stat cards for sent today, waiting and uploads; the Now & Recent stream of uploads; the Data Sent chart of the last 24 hours
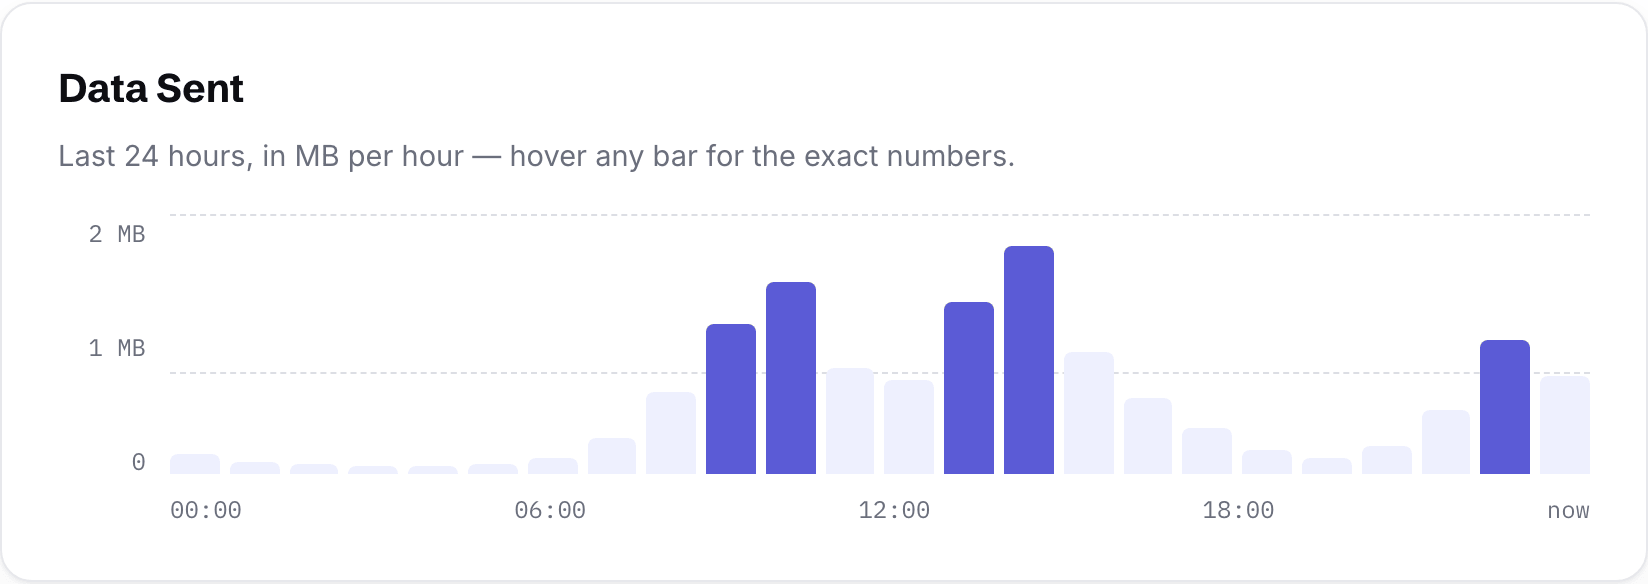
The Data Sent chart with a hover tooltip showing the exact megabytes and session count for one hour
The last 24 hours, hour by hour — hover any bar for the exact numbers.
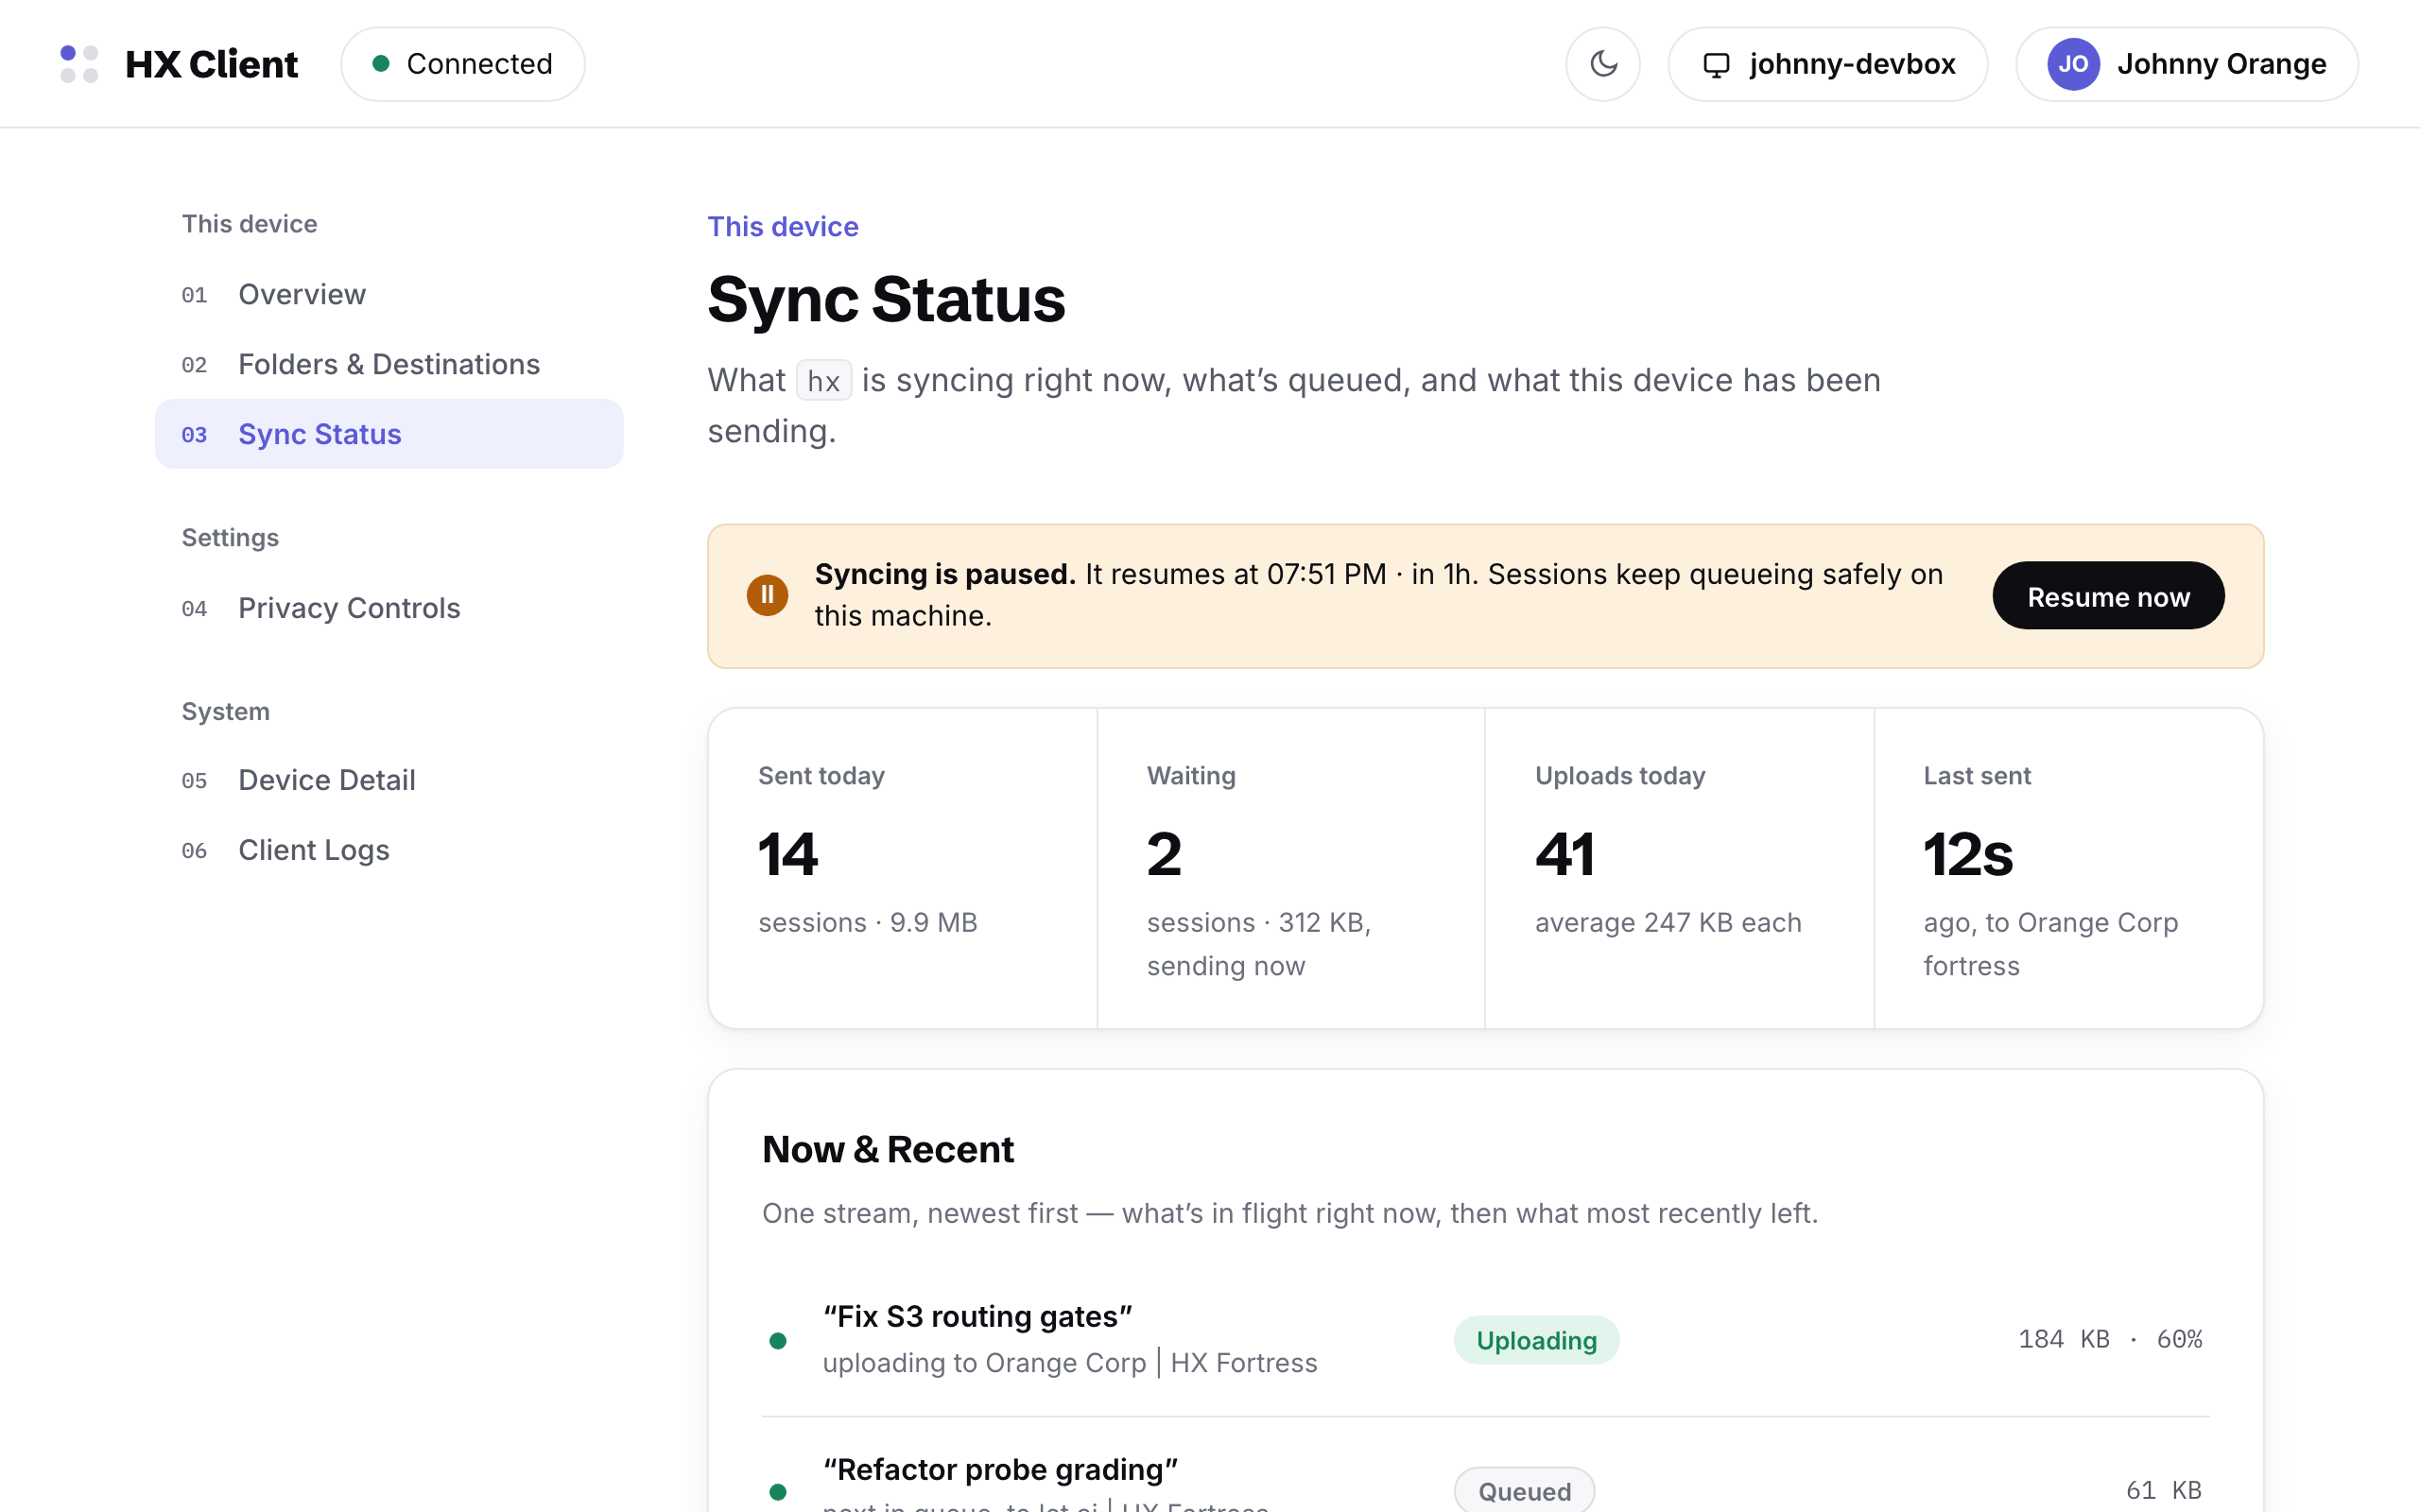
Sync Status while paused: a banner explains syncing is paused, sessions keep queueing safely, with a resume button
Paused is a first-class state: sessions queue safely on the machine and catch up on resume.
04Settings

Privacy Controls

Everything the daemon does is visible and reversible from one screen: the personal-session switch, pause, per-folder exclusions, rules for folders that don't exist yet, the secrets hold-back — and a danger zone for disconnecting, deleting synced sessions, and uninstalling.
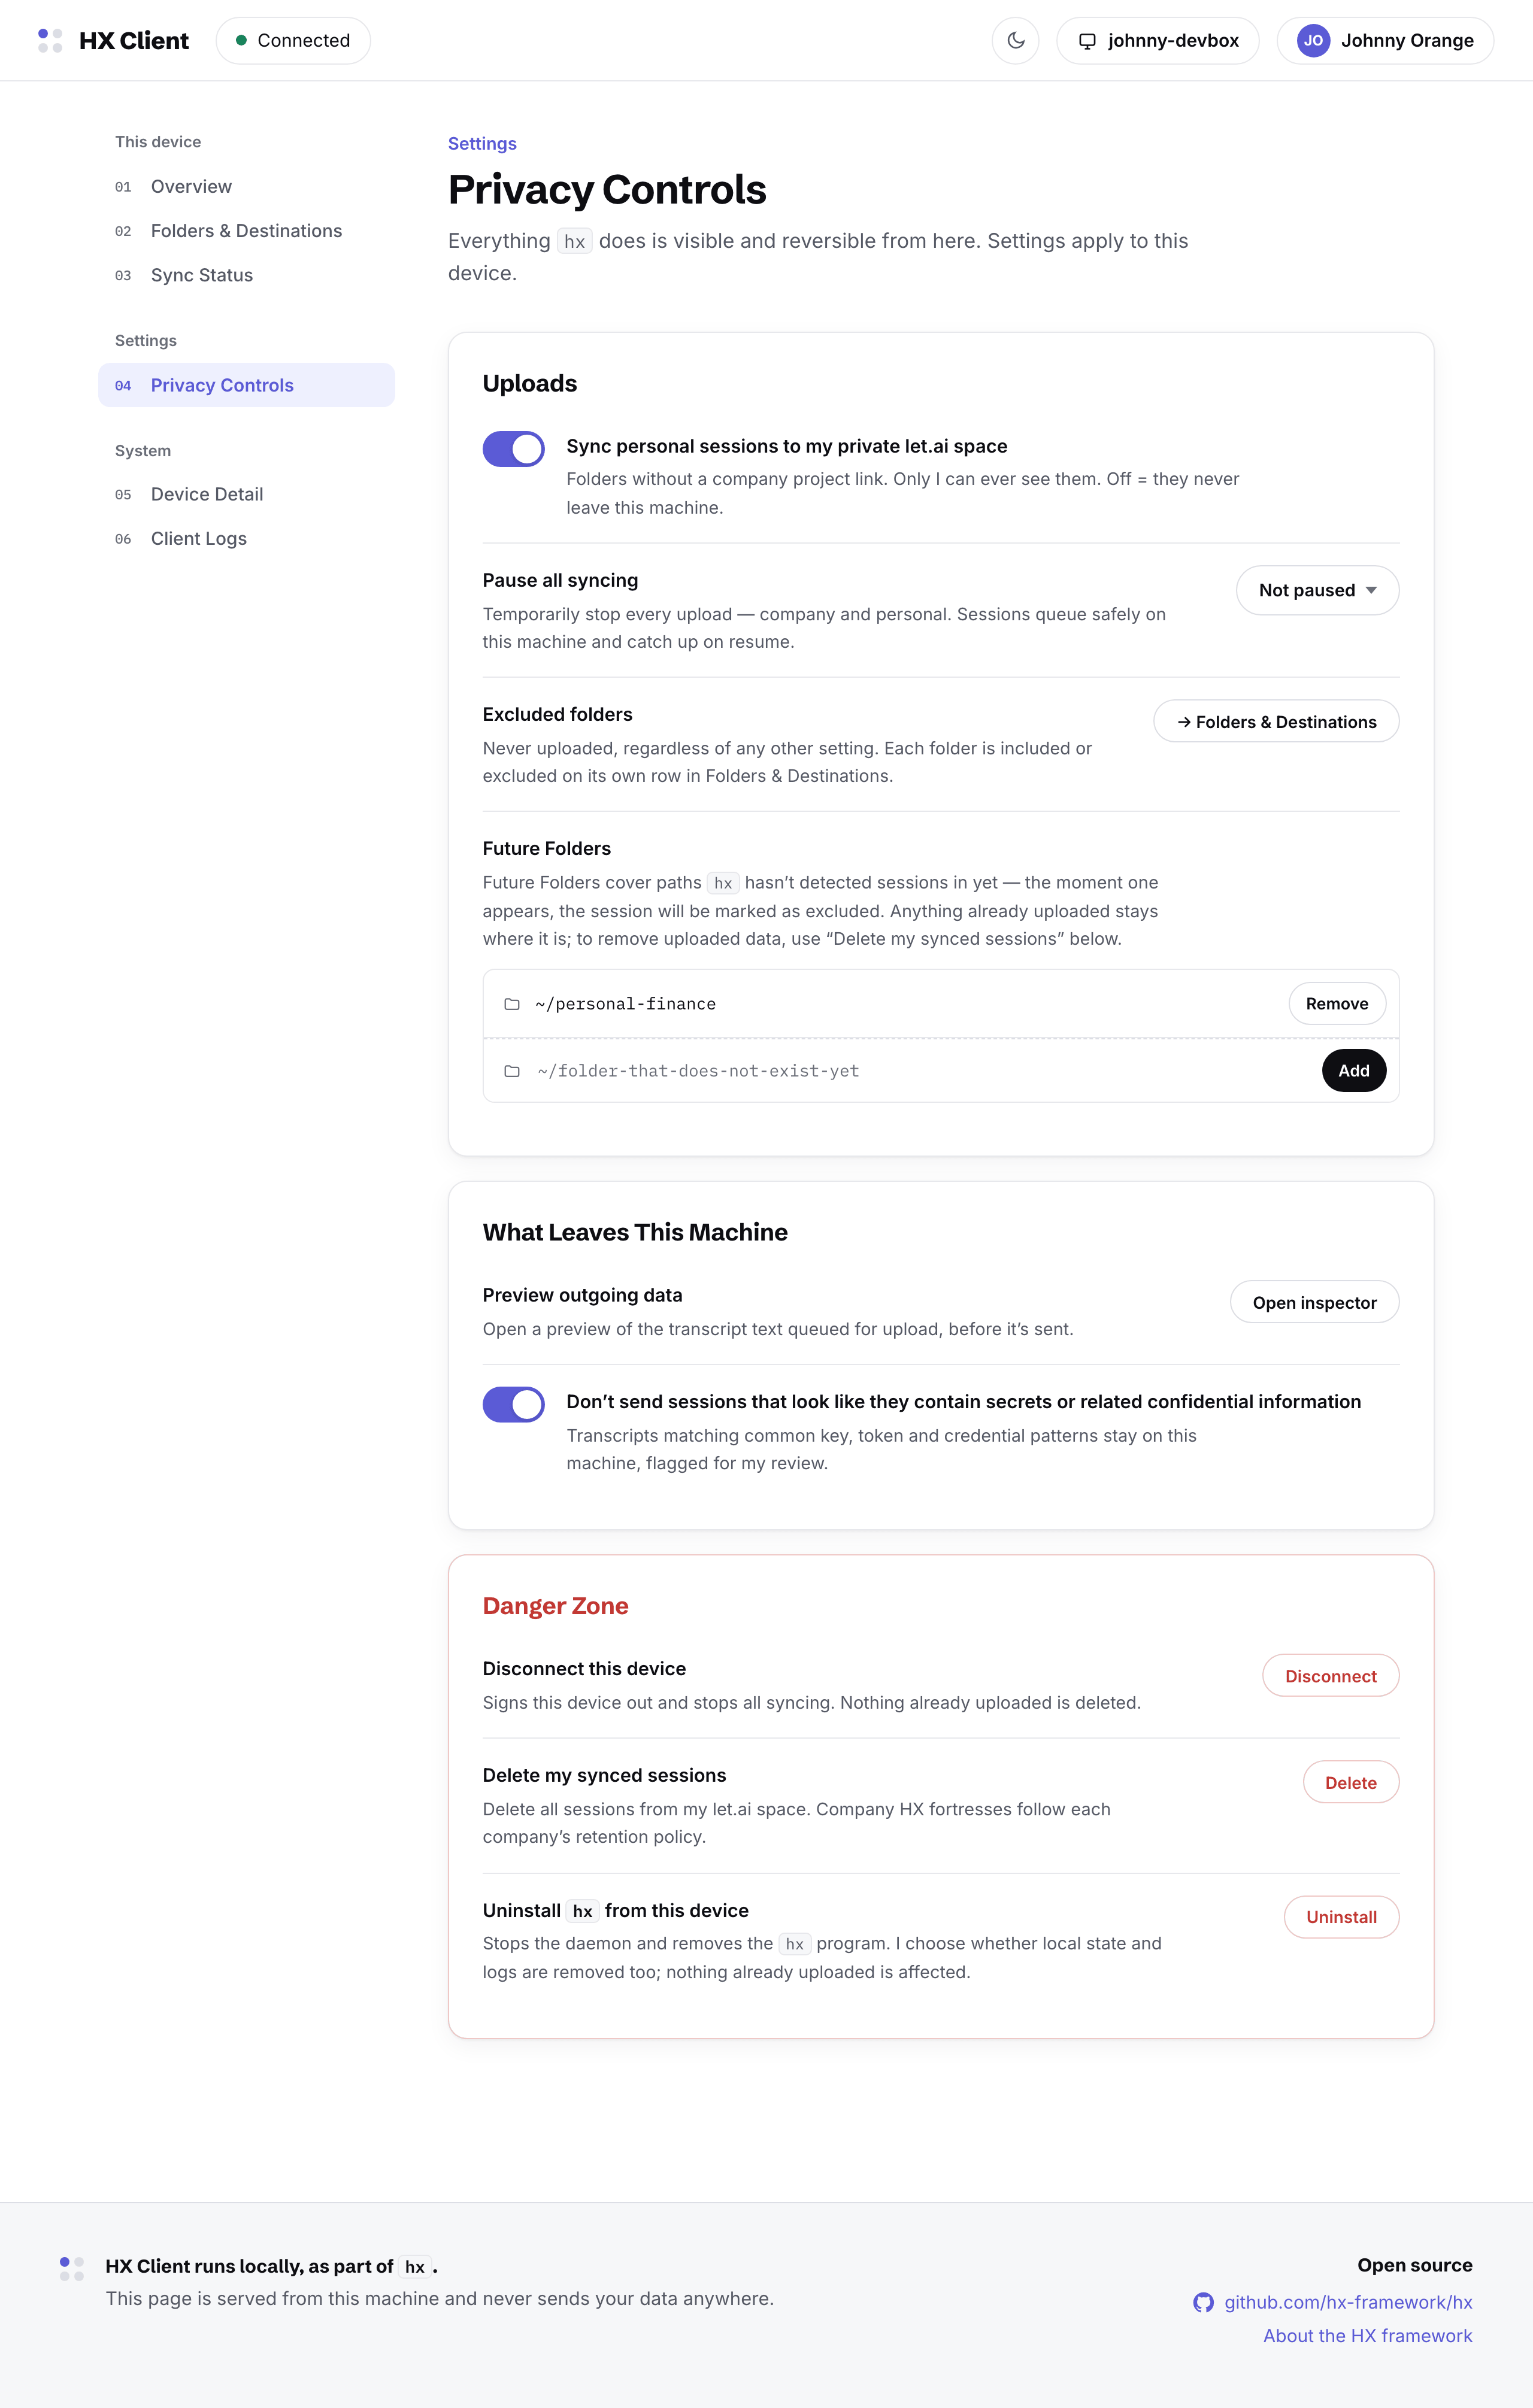
Privacy Controls: uploads panel with personal-session switch, pause and exclusions; the What Leaves This Machine panel; the danger zone
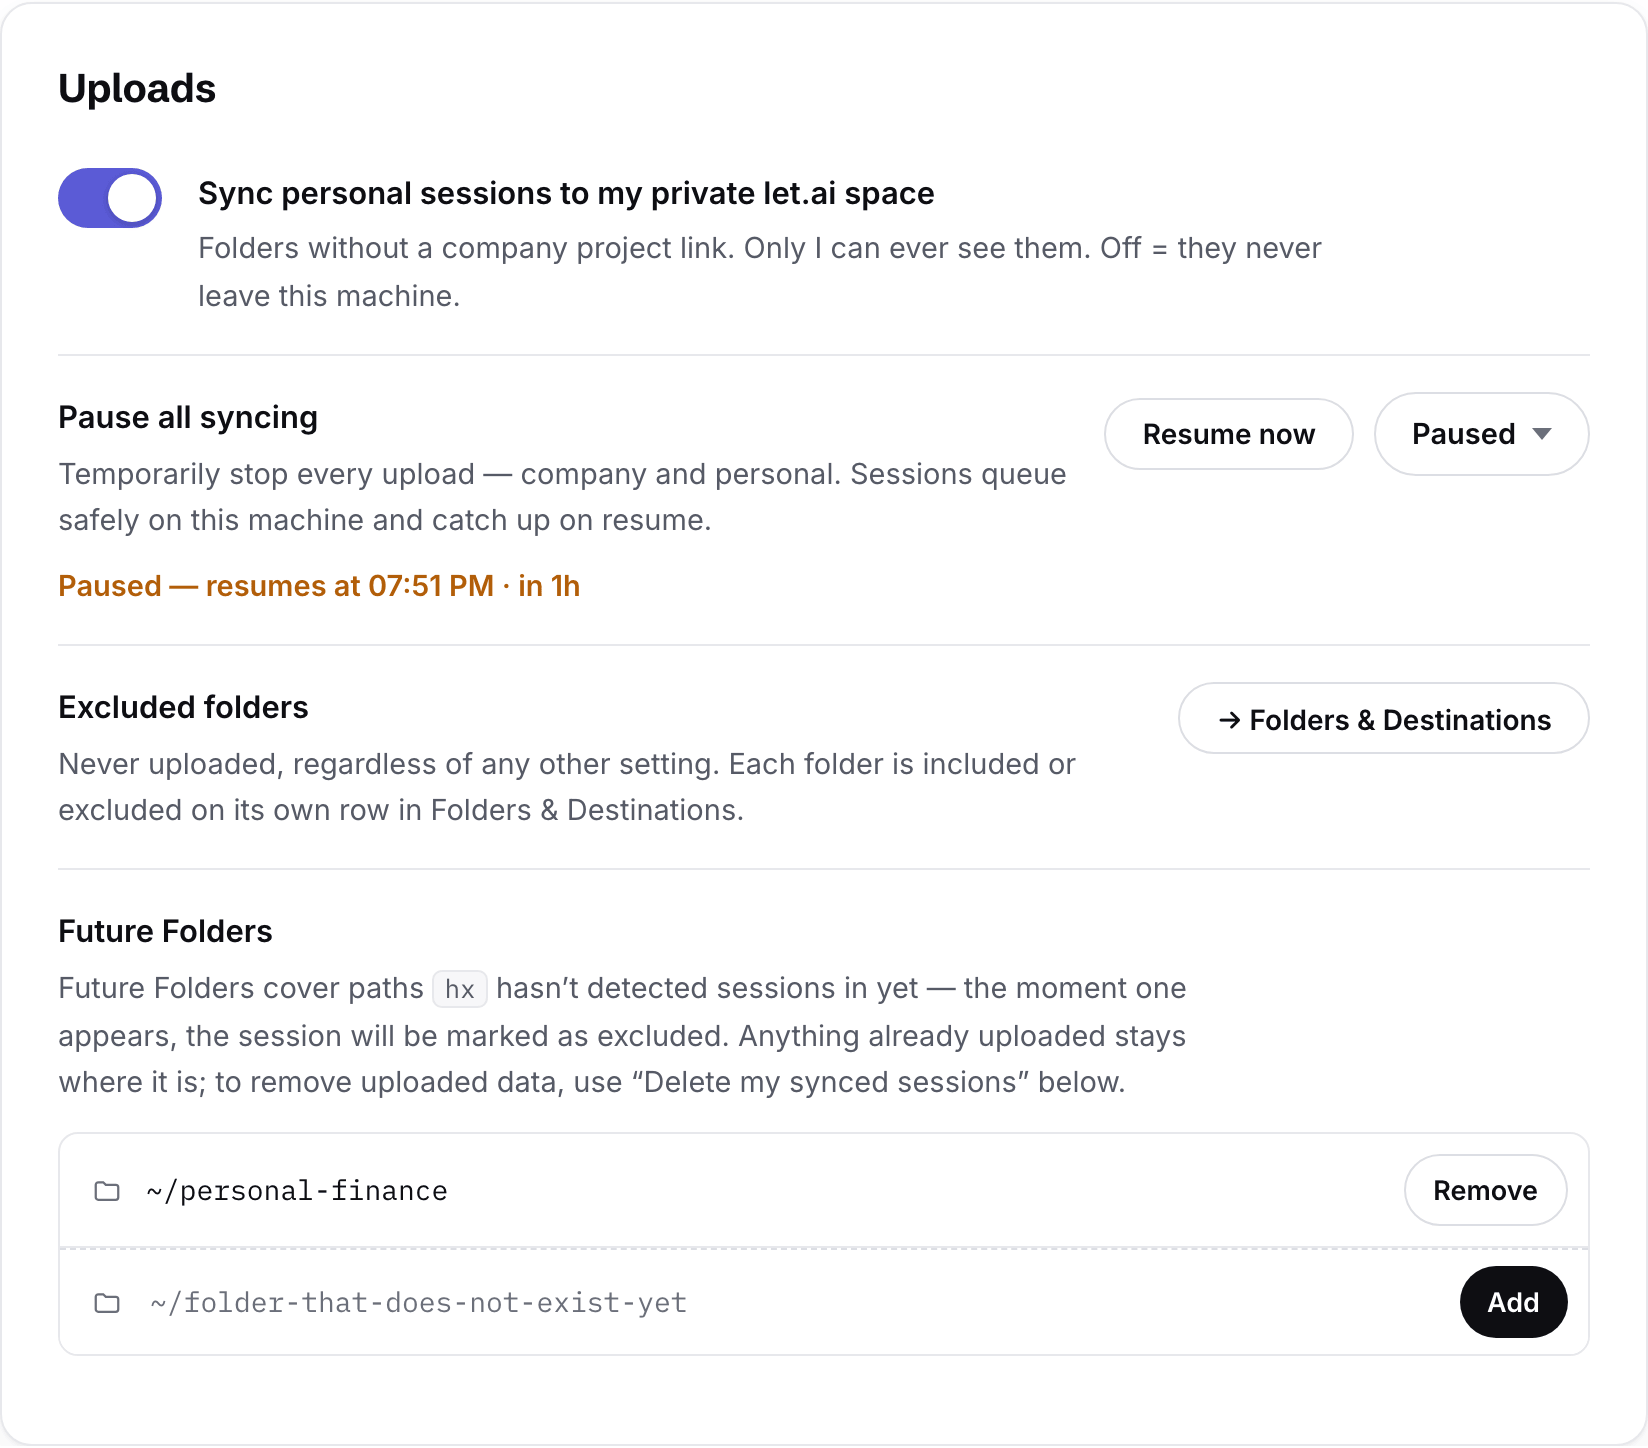
The uploads panel while paused: the pause state line shows when syncing resumes, with a resume-now button
Pause for fifteen minutes, an hour, until tomorrow, or until resumed — always with a visible way back.
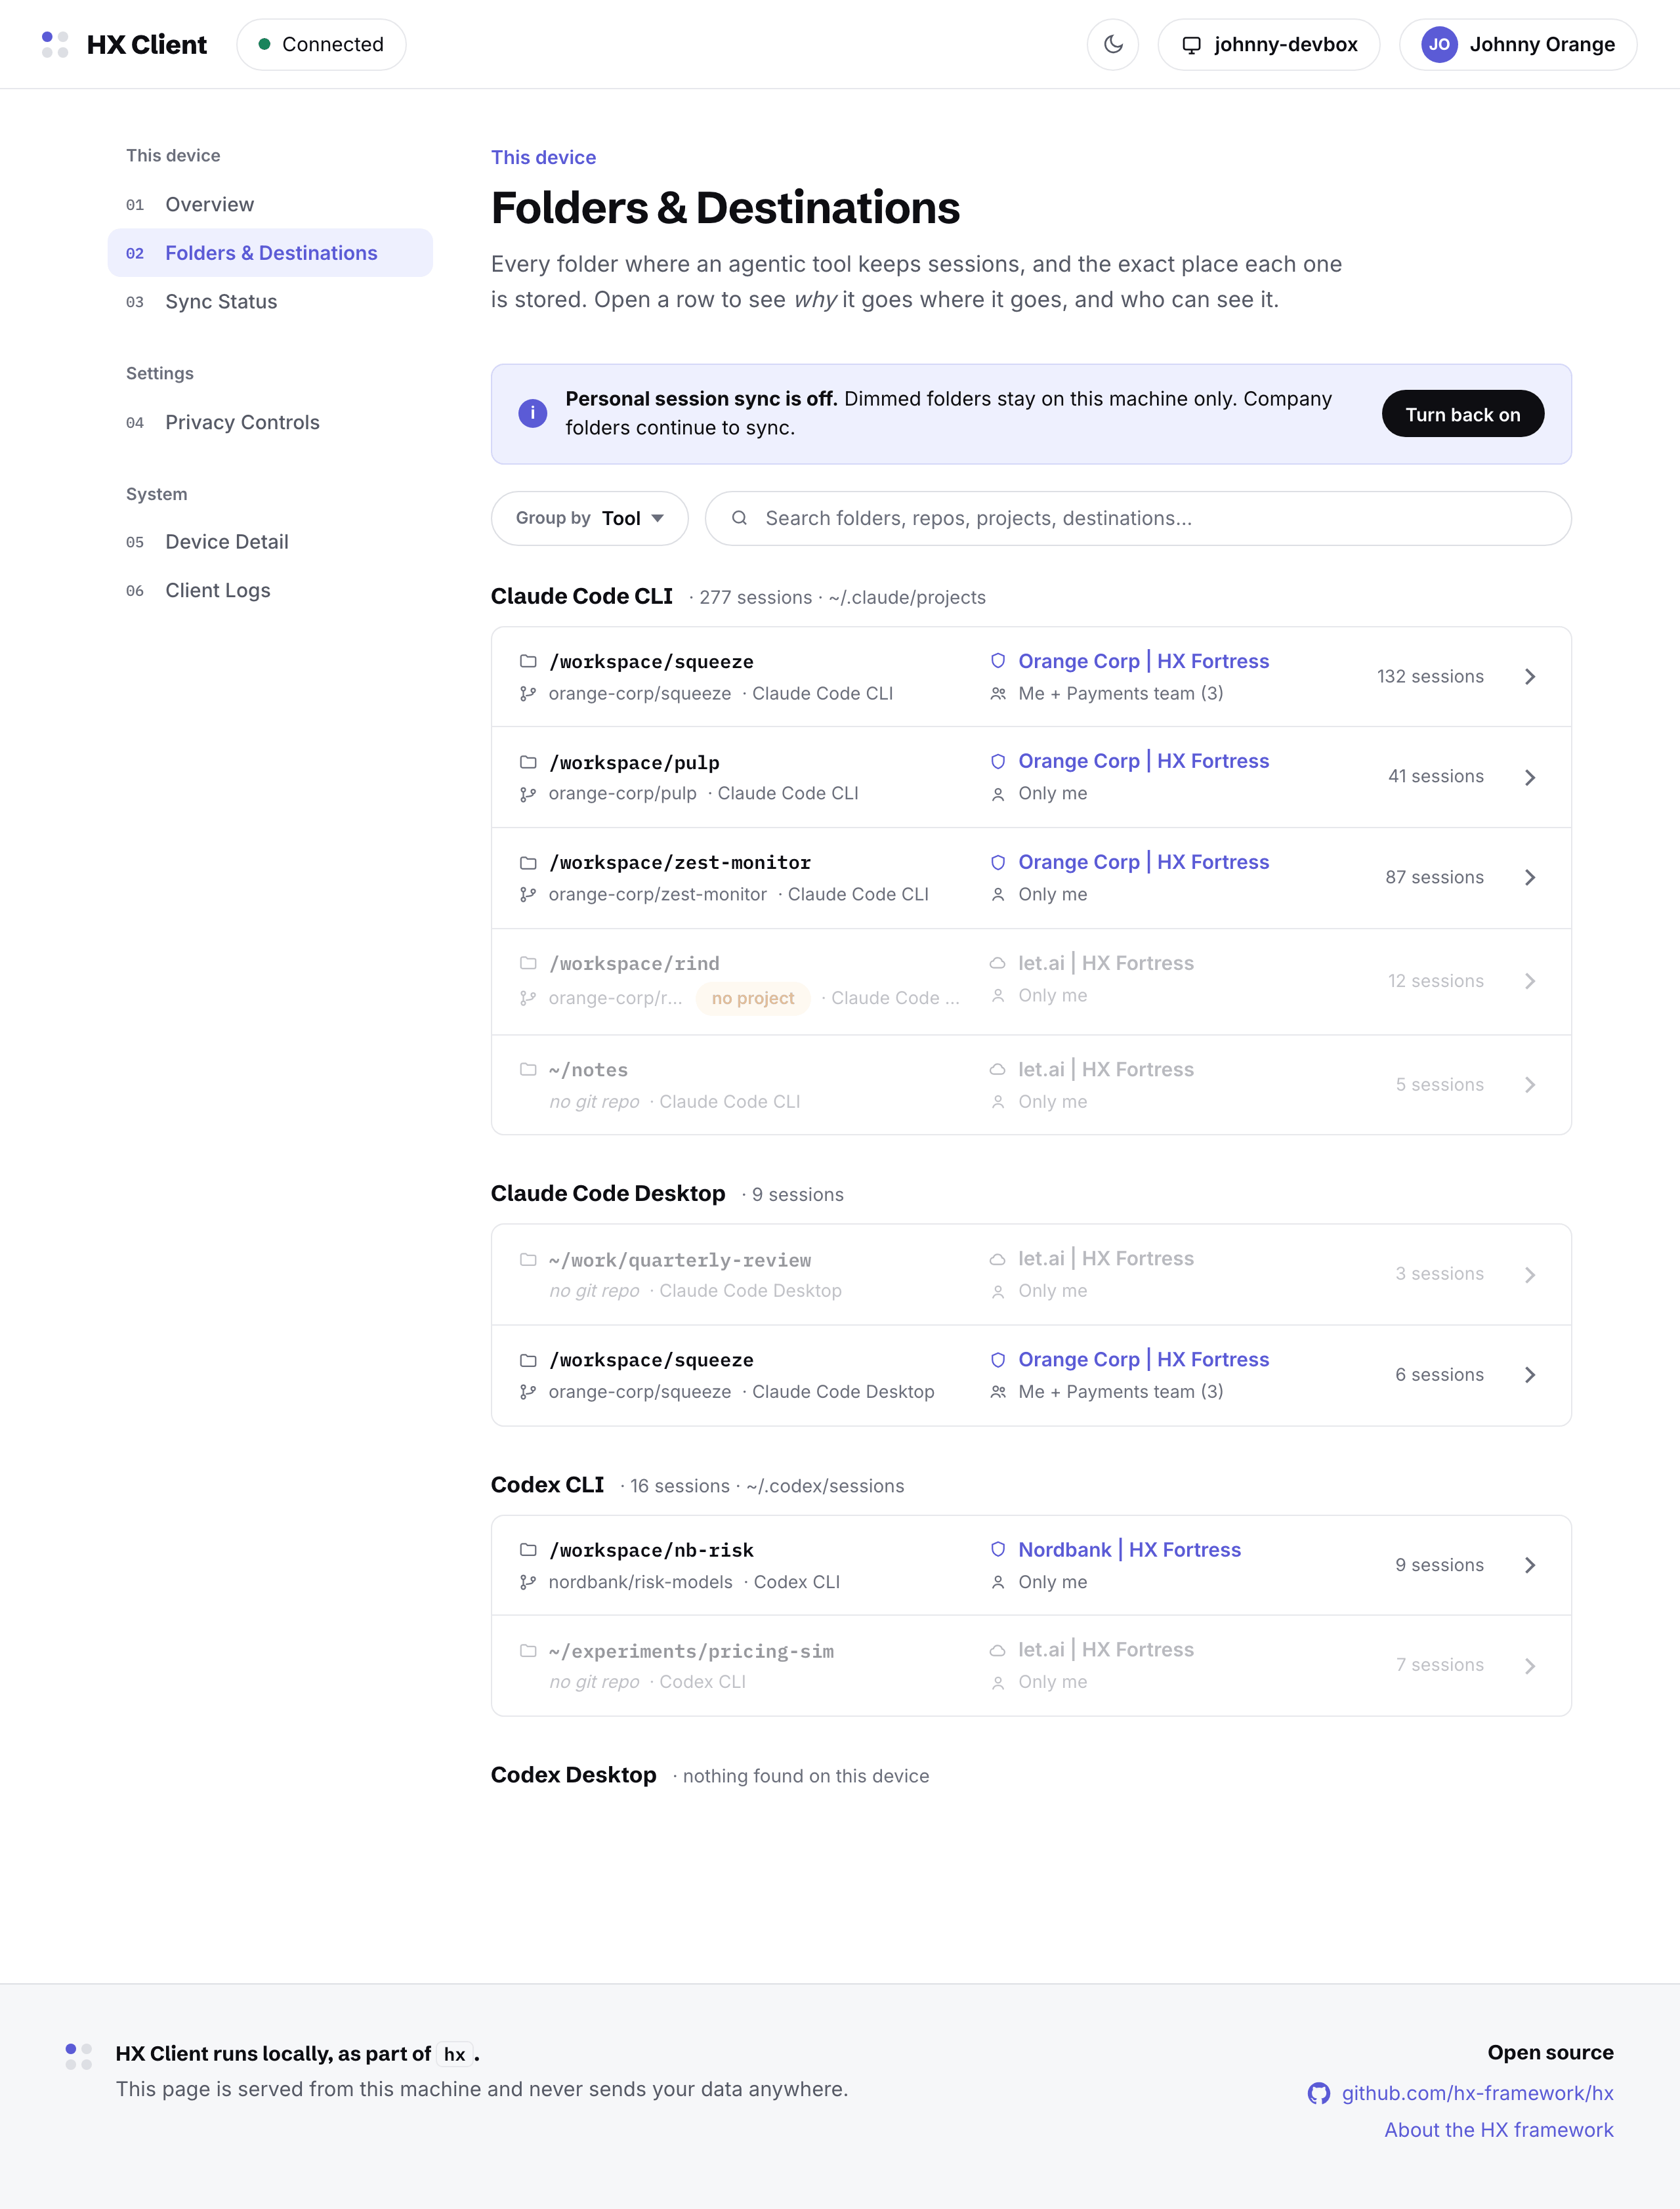
Folders & Destinations with personal sync off: personal folders dimmed and staying on this machine, company folders unaffected
Personal sync off: personal folders stay on the machine, dimmed; company folders are unaffected.
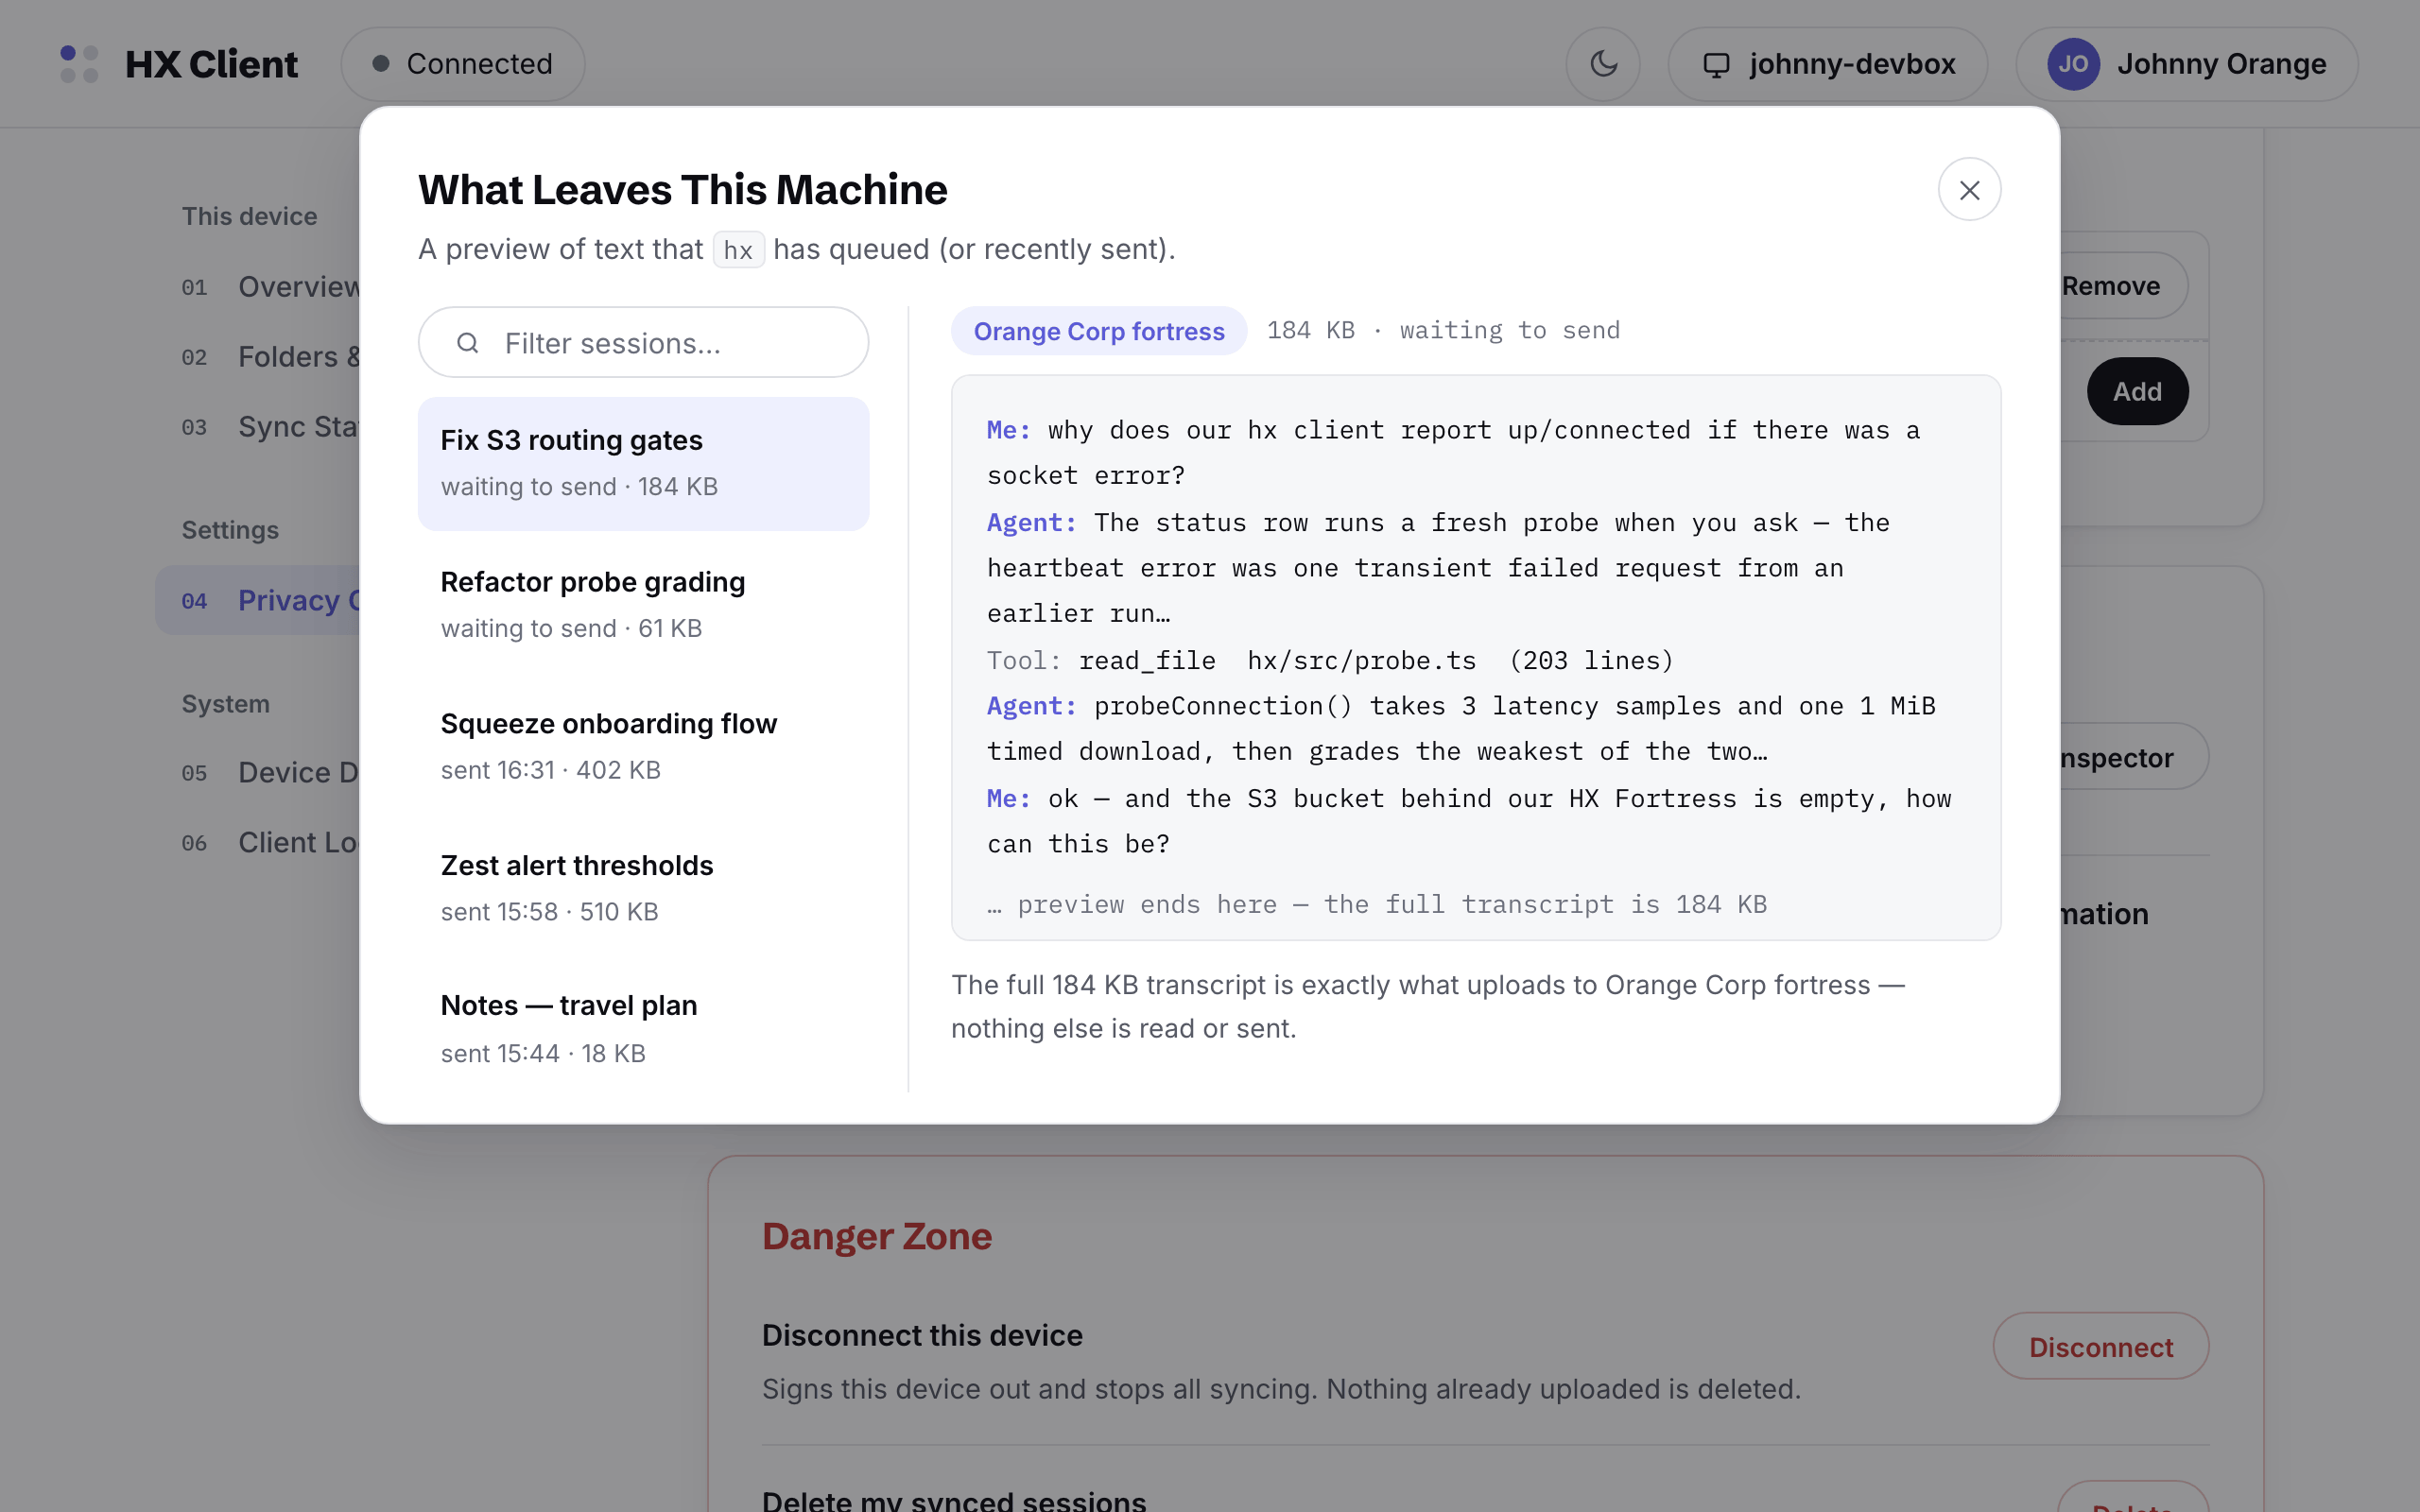
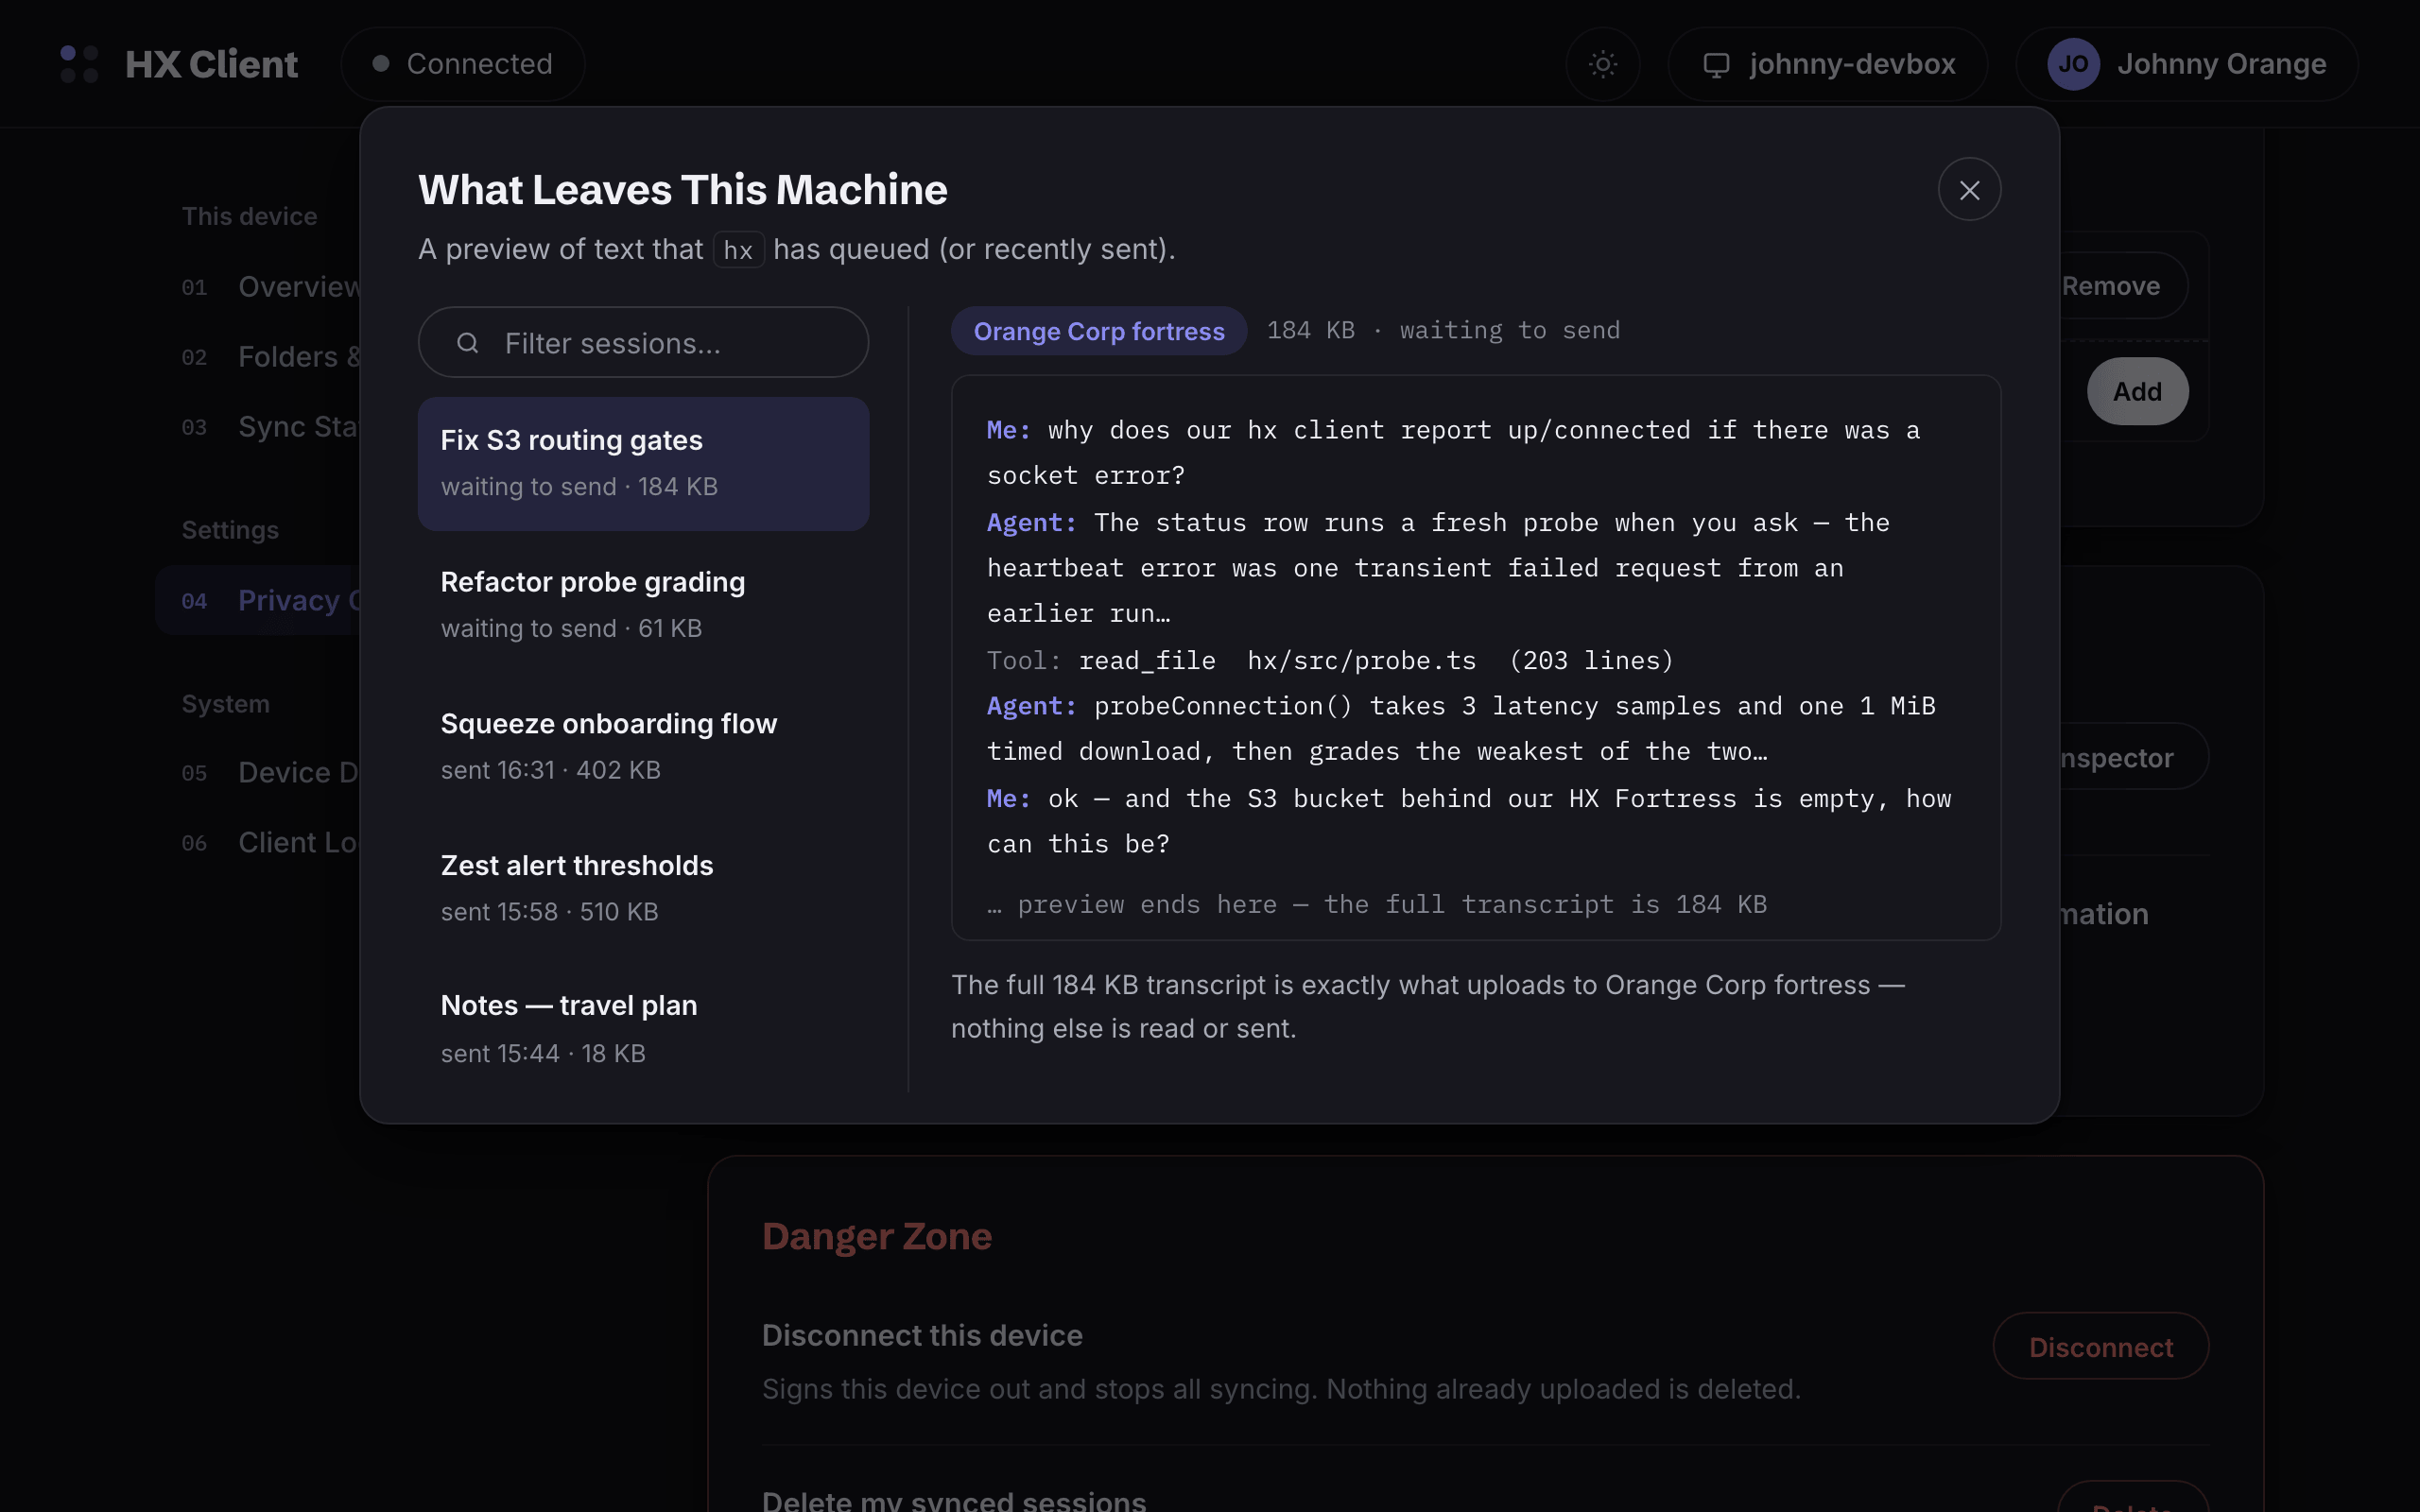
The What Leaves This Machine inspector: queued sessions listed left, and the exact transcript text to be uploaded shown right
The inspector: the exact text queued for upload, previewed before it goes. The transcript shown is exactly what uploads.
05System

Device Detail

Friendly at a glance, specific enough to debug over a screen share: identity, connection, the sync engine's state and cadence, local file paths, recent issues — and the maintenance tools.
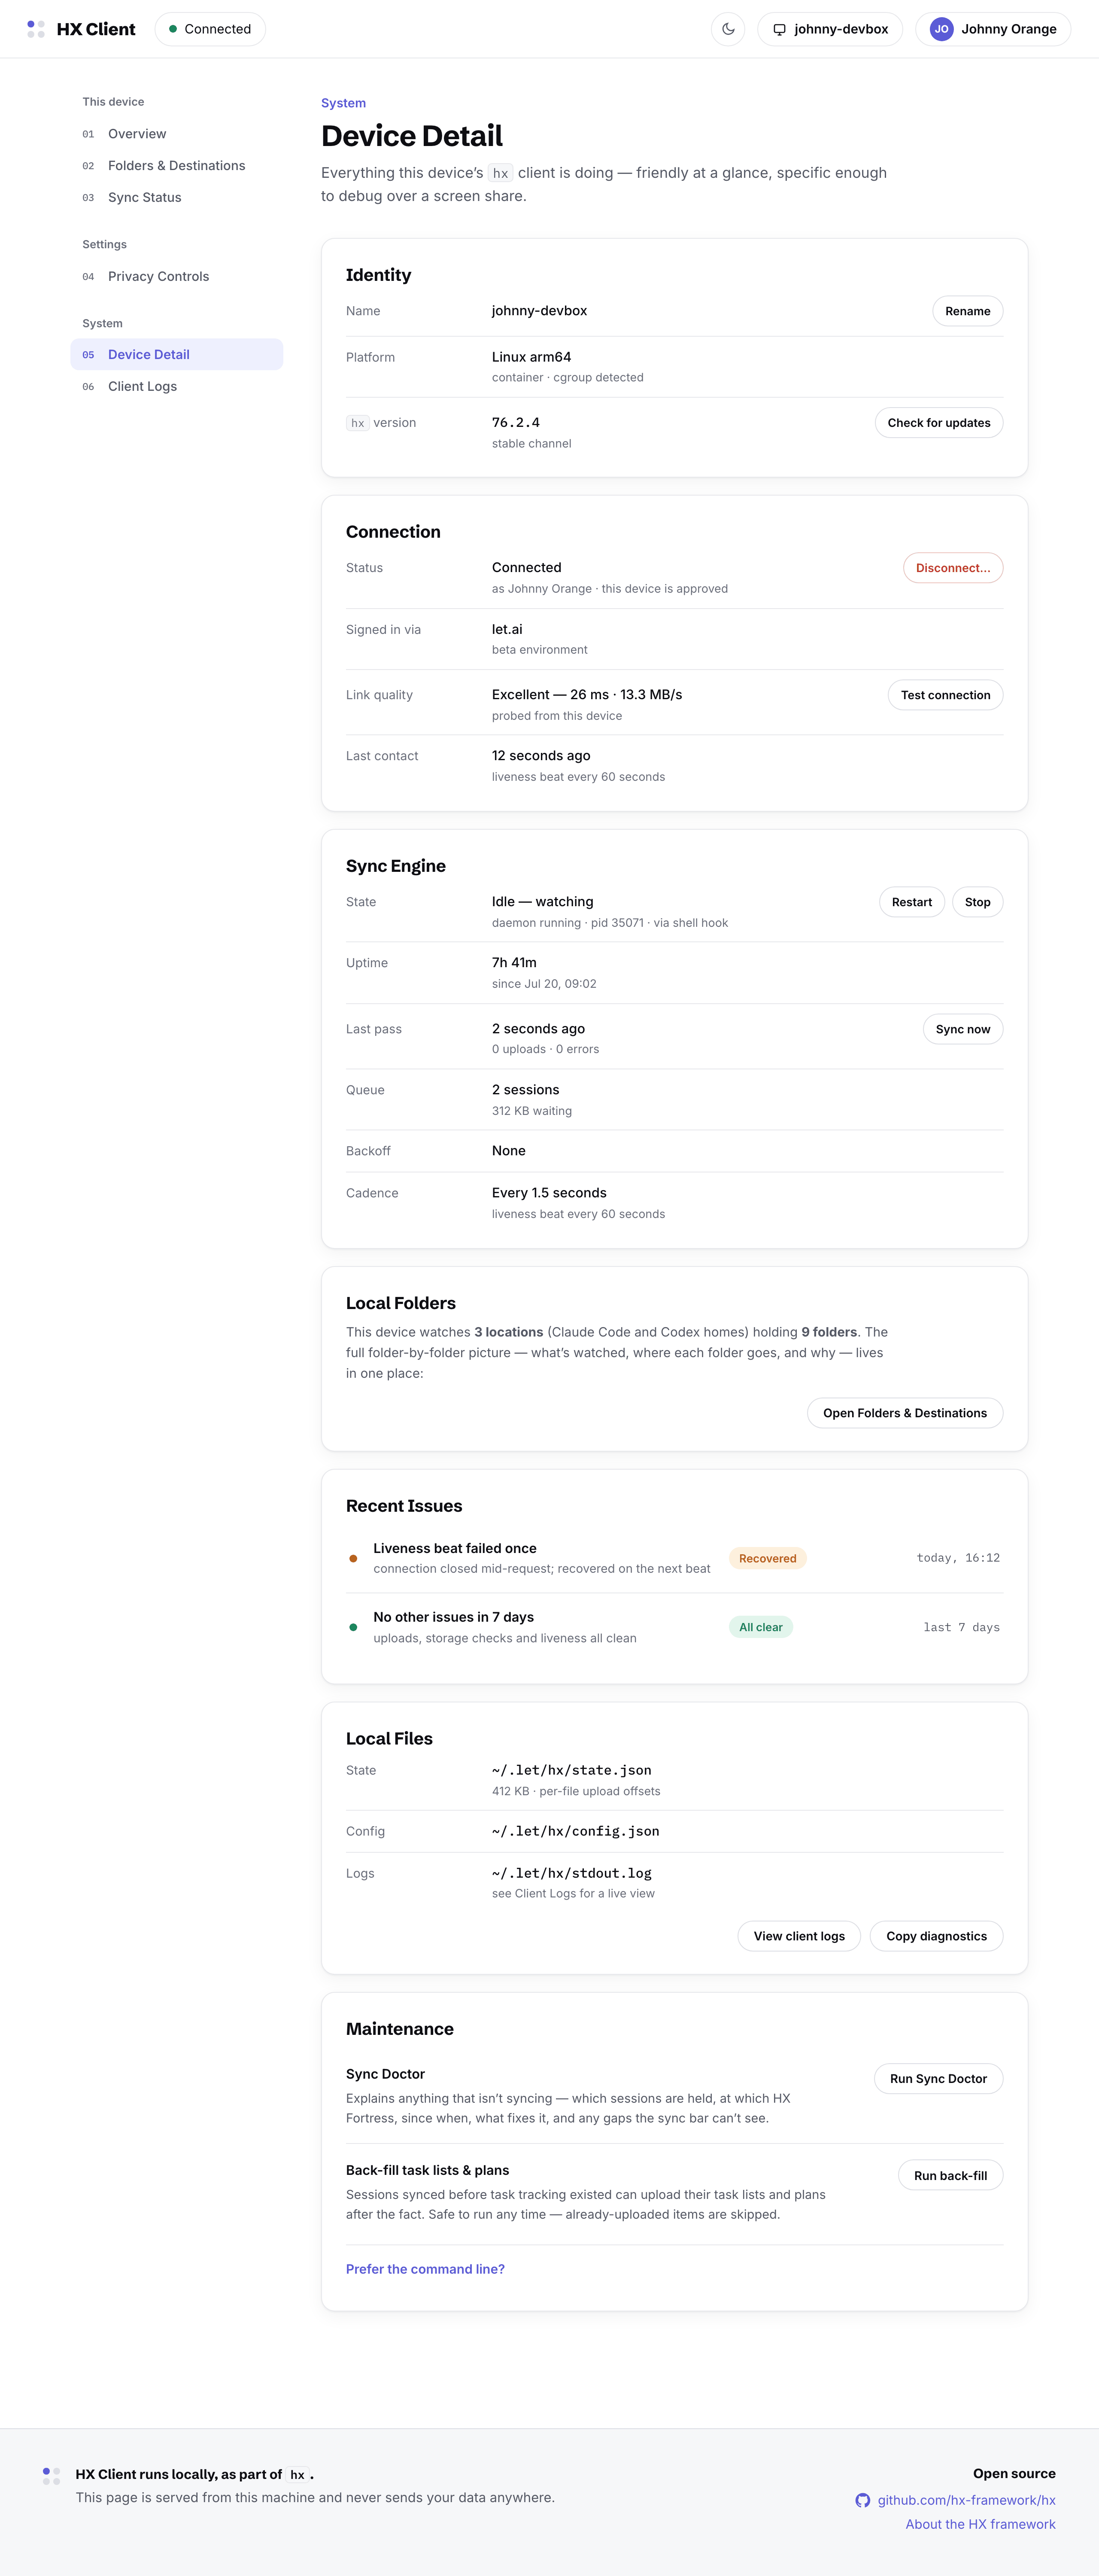
Device Detail: identity with rename and update, connection status, sync engine state with restart and stop, local folders, recent issues, local files and maintenance
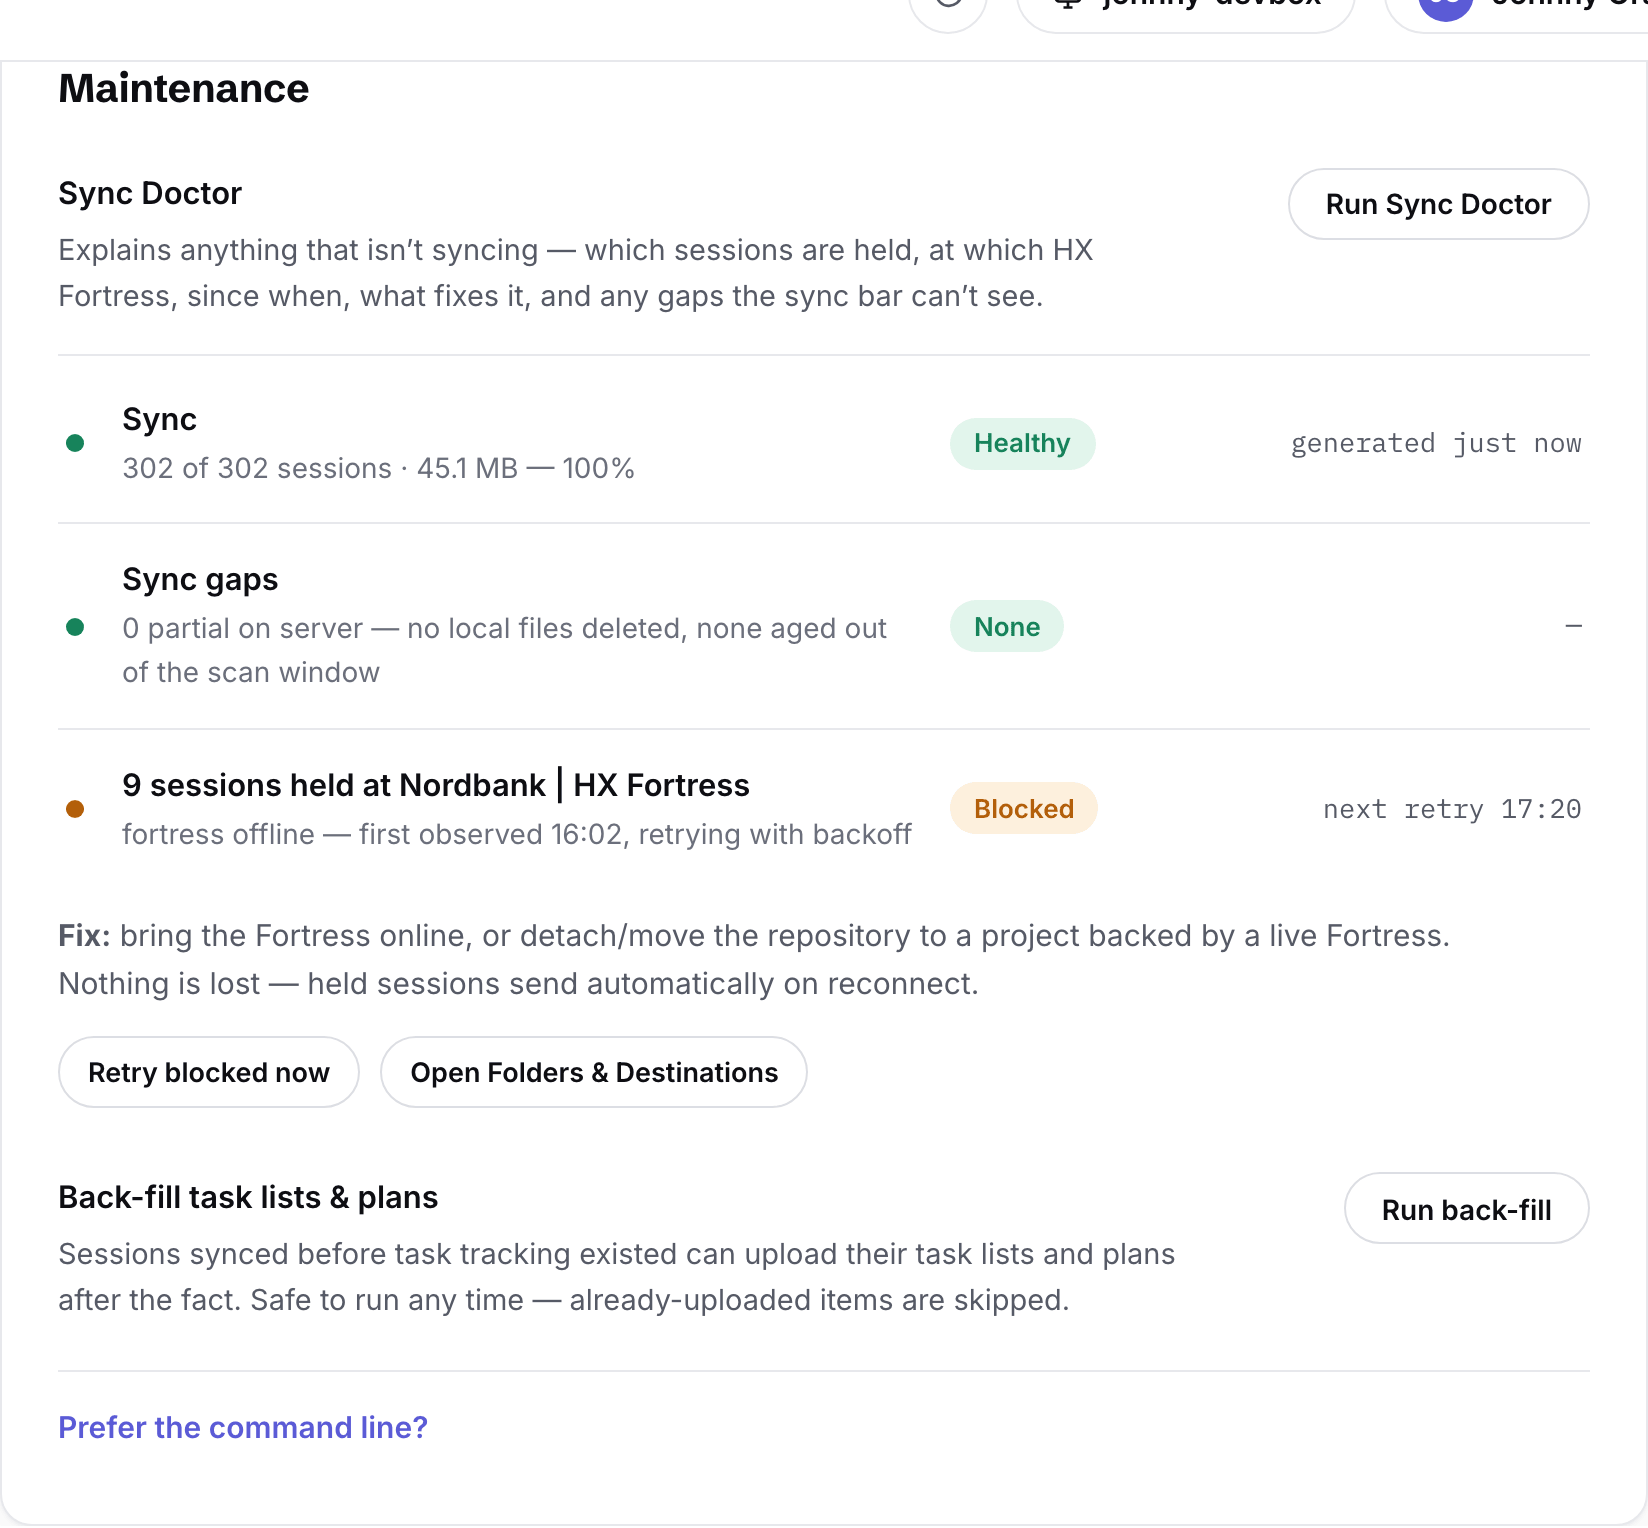
Sync Doctor output: sync healthy at 100%, no gaps, and nine sessions held at an offline fortress with the fix spelled out
Sync Doctor names what's blocked, where, since when — and the fix. Held sessions send automatically on reconnect.
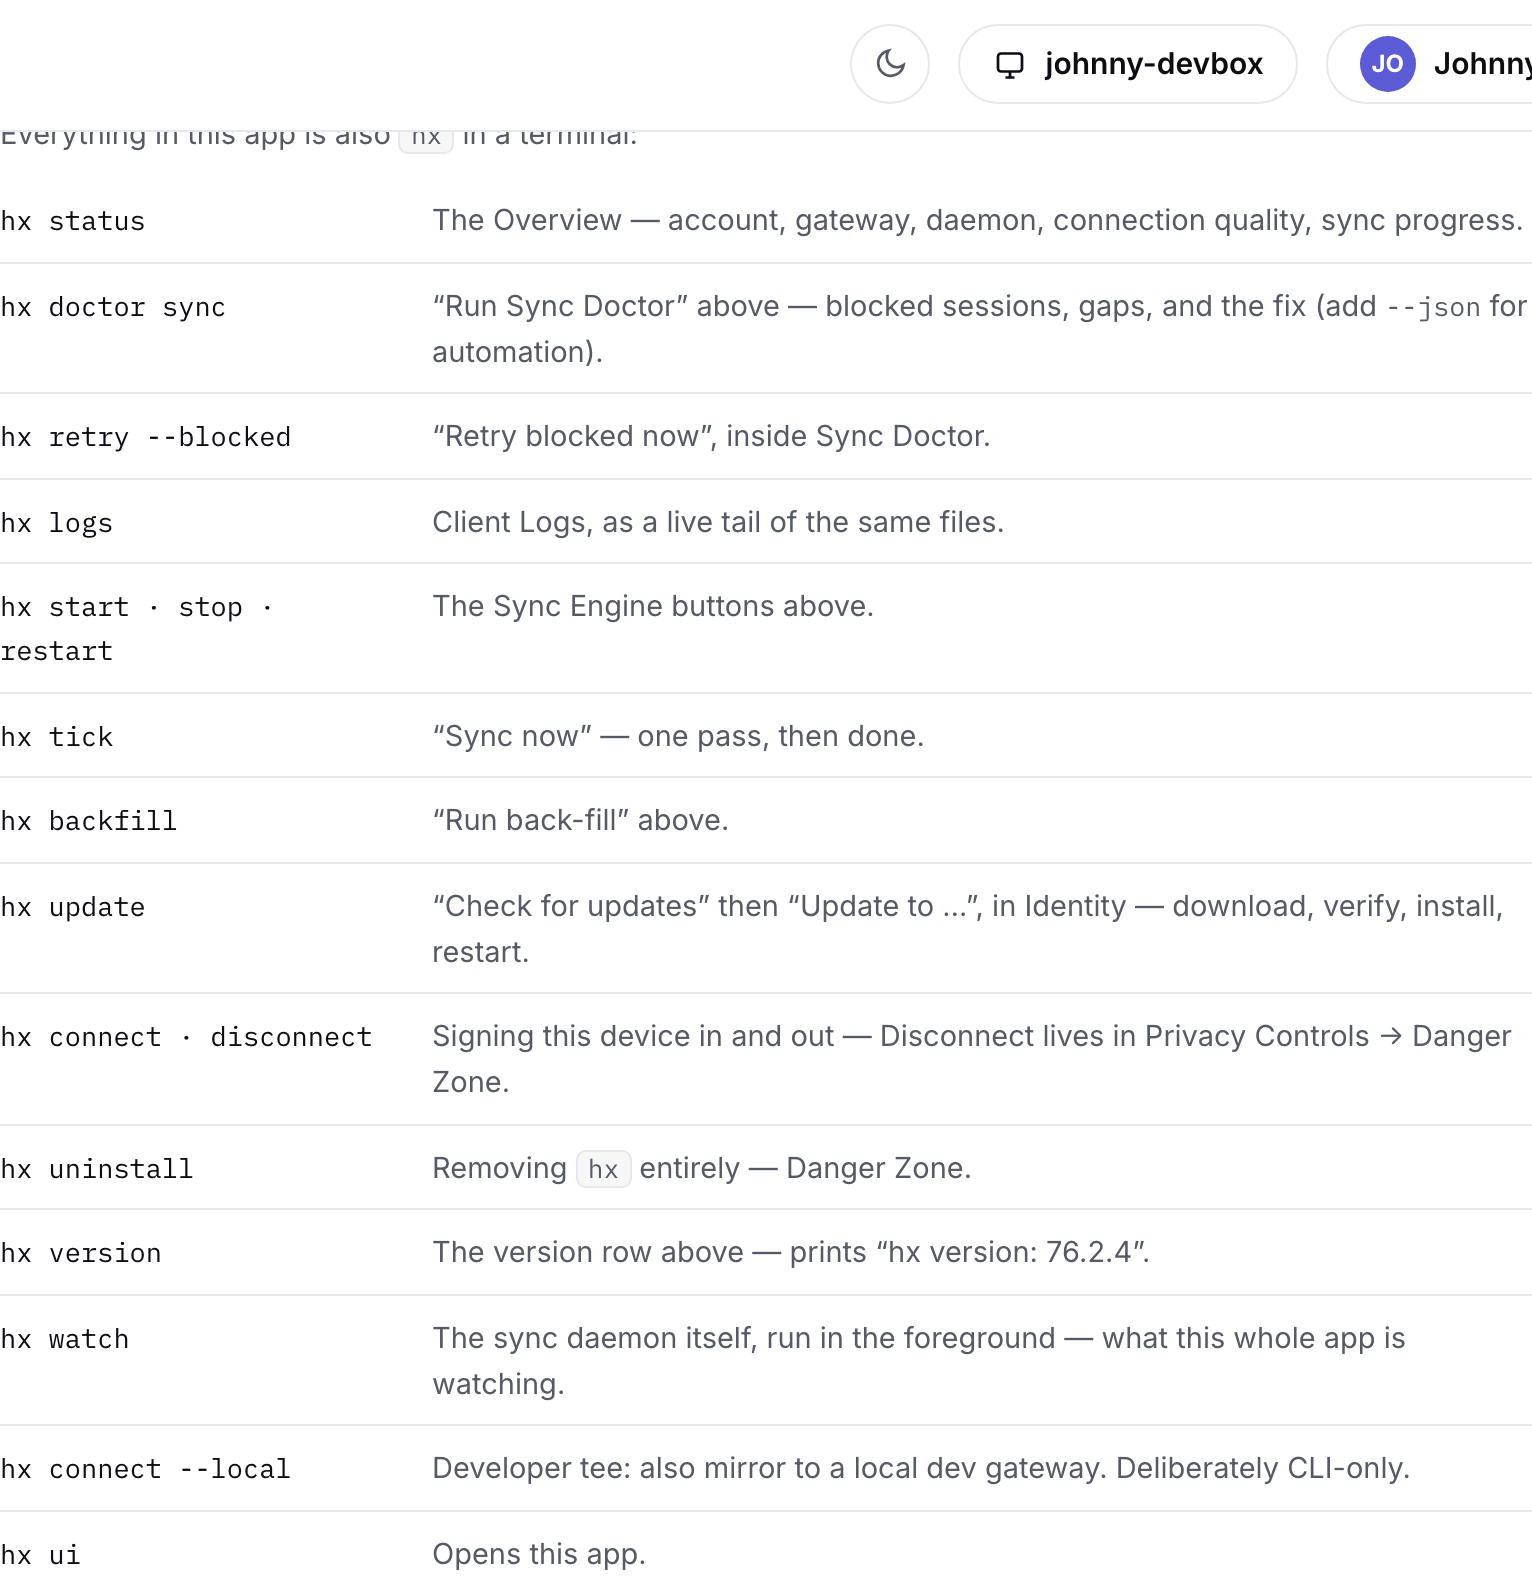
The command-line reference: every screen of the interface mapped to its hx command, from hx status to hx uninstall
Everything in the interface is also a command — the same facts, from the same local state.
06System

Client Logs

The one technical page: the daemon's own words, for when something needs a closer look. Levels, live filtering, copy, download — and the logs stay on the machine.
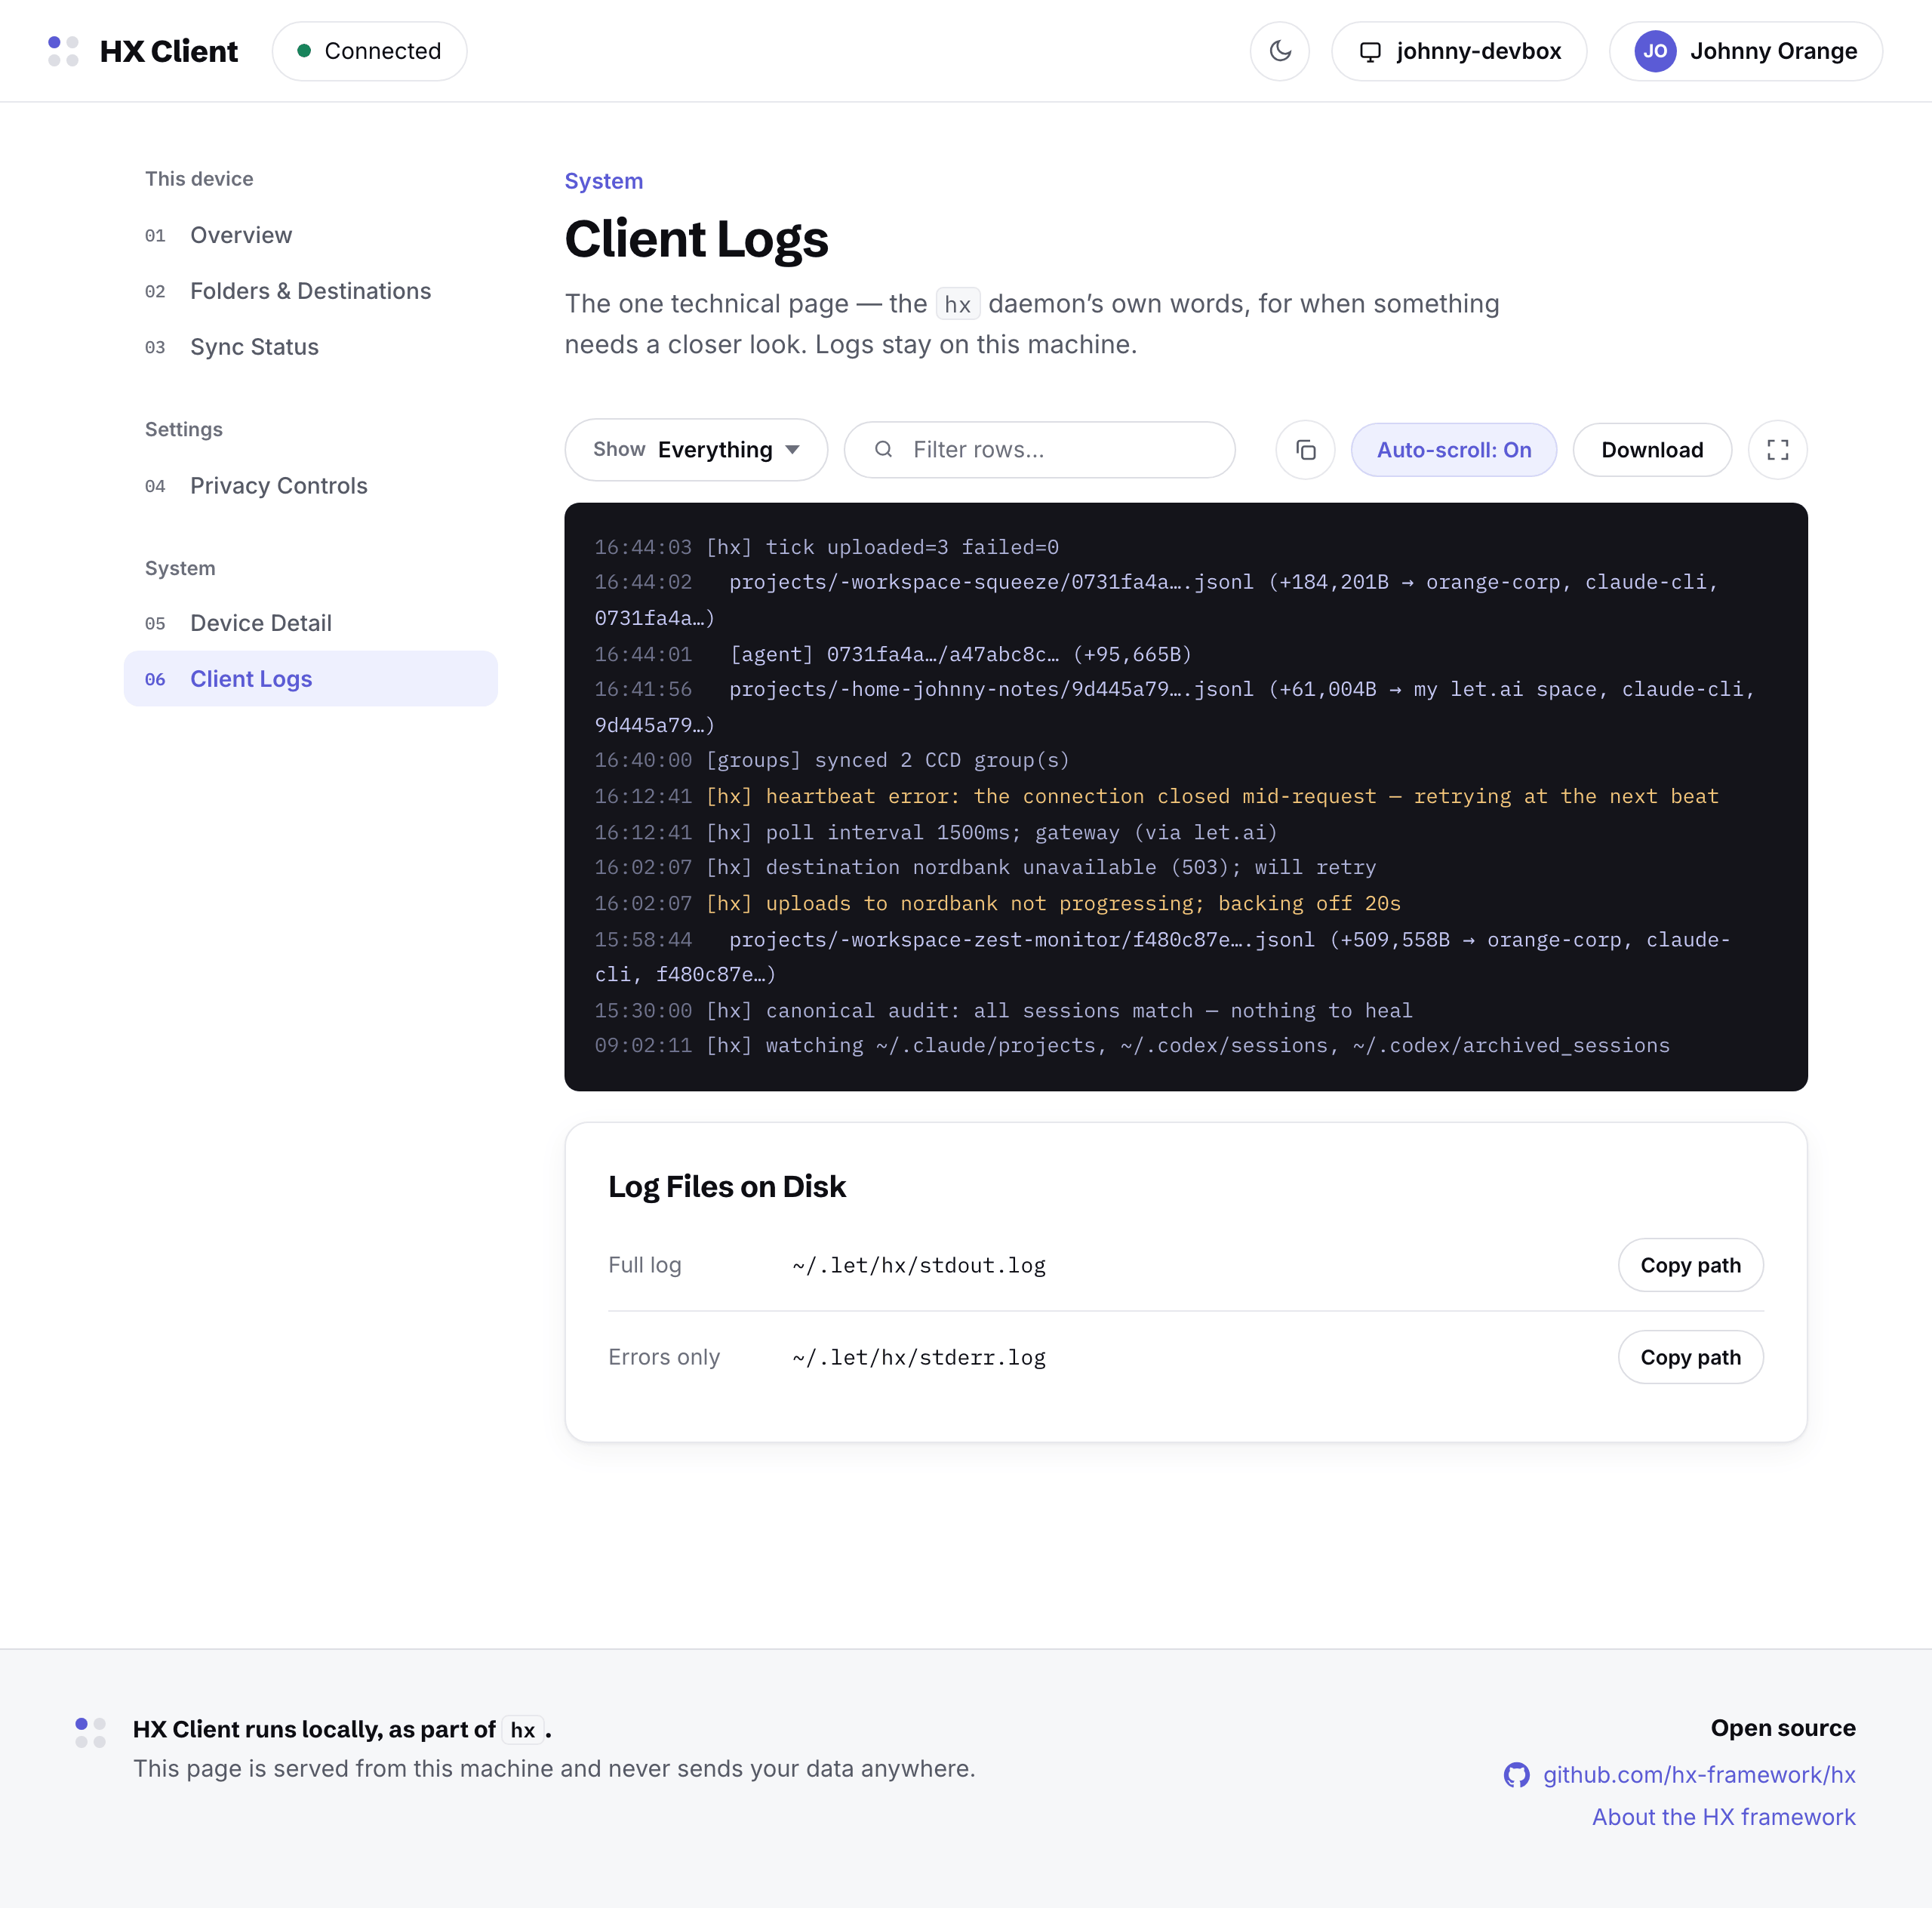
Client Logs: a live log pane with upload lines, warnings and info, level filter and search, plus the log file paths on disk
Destinations

A page per fortress

Each destination gets its own page: the folders that rest there, connection quality, and storage integrity — including a check that writes a test object and reads it back, so the store is proven rather than presumed.
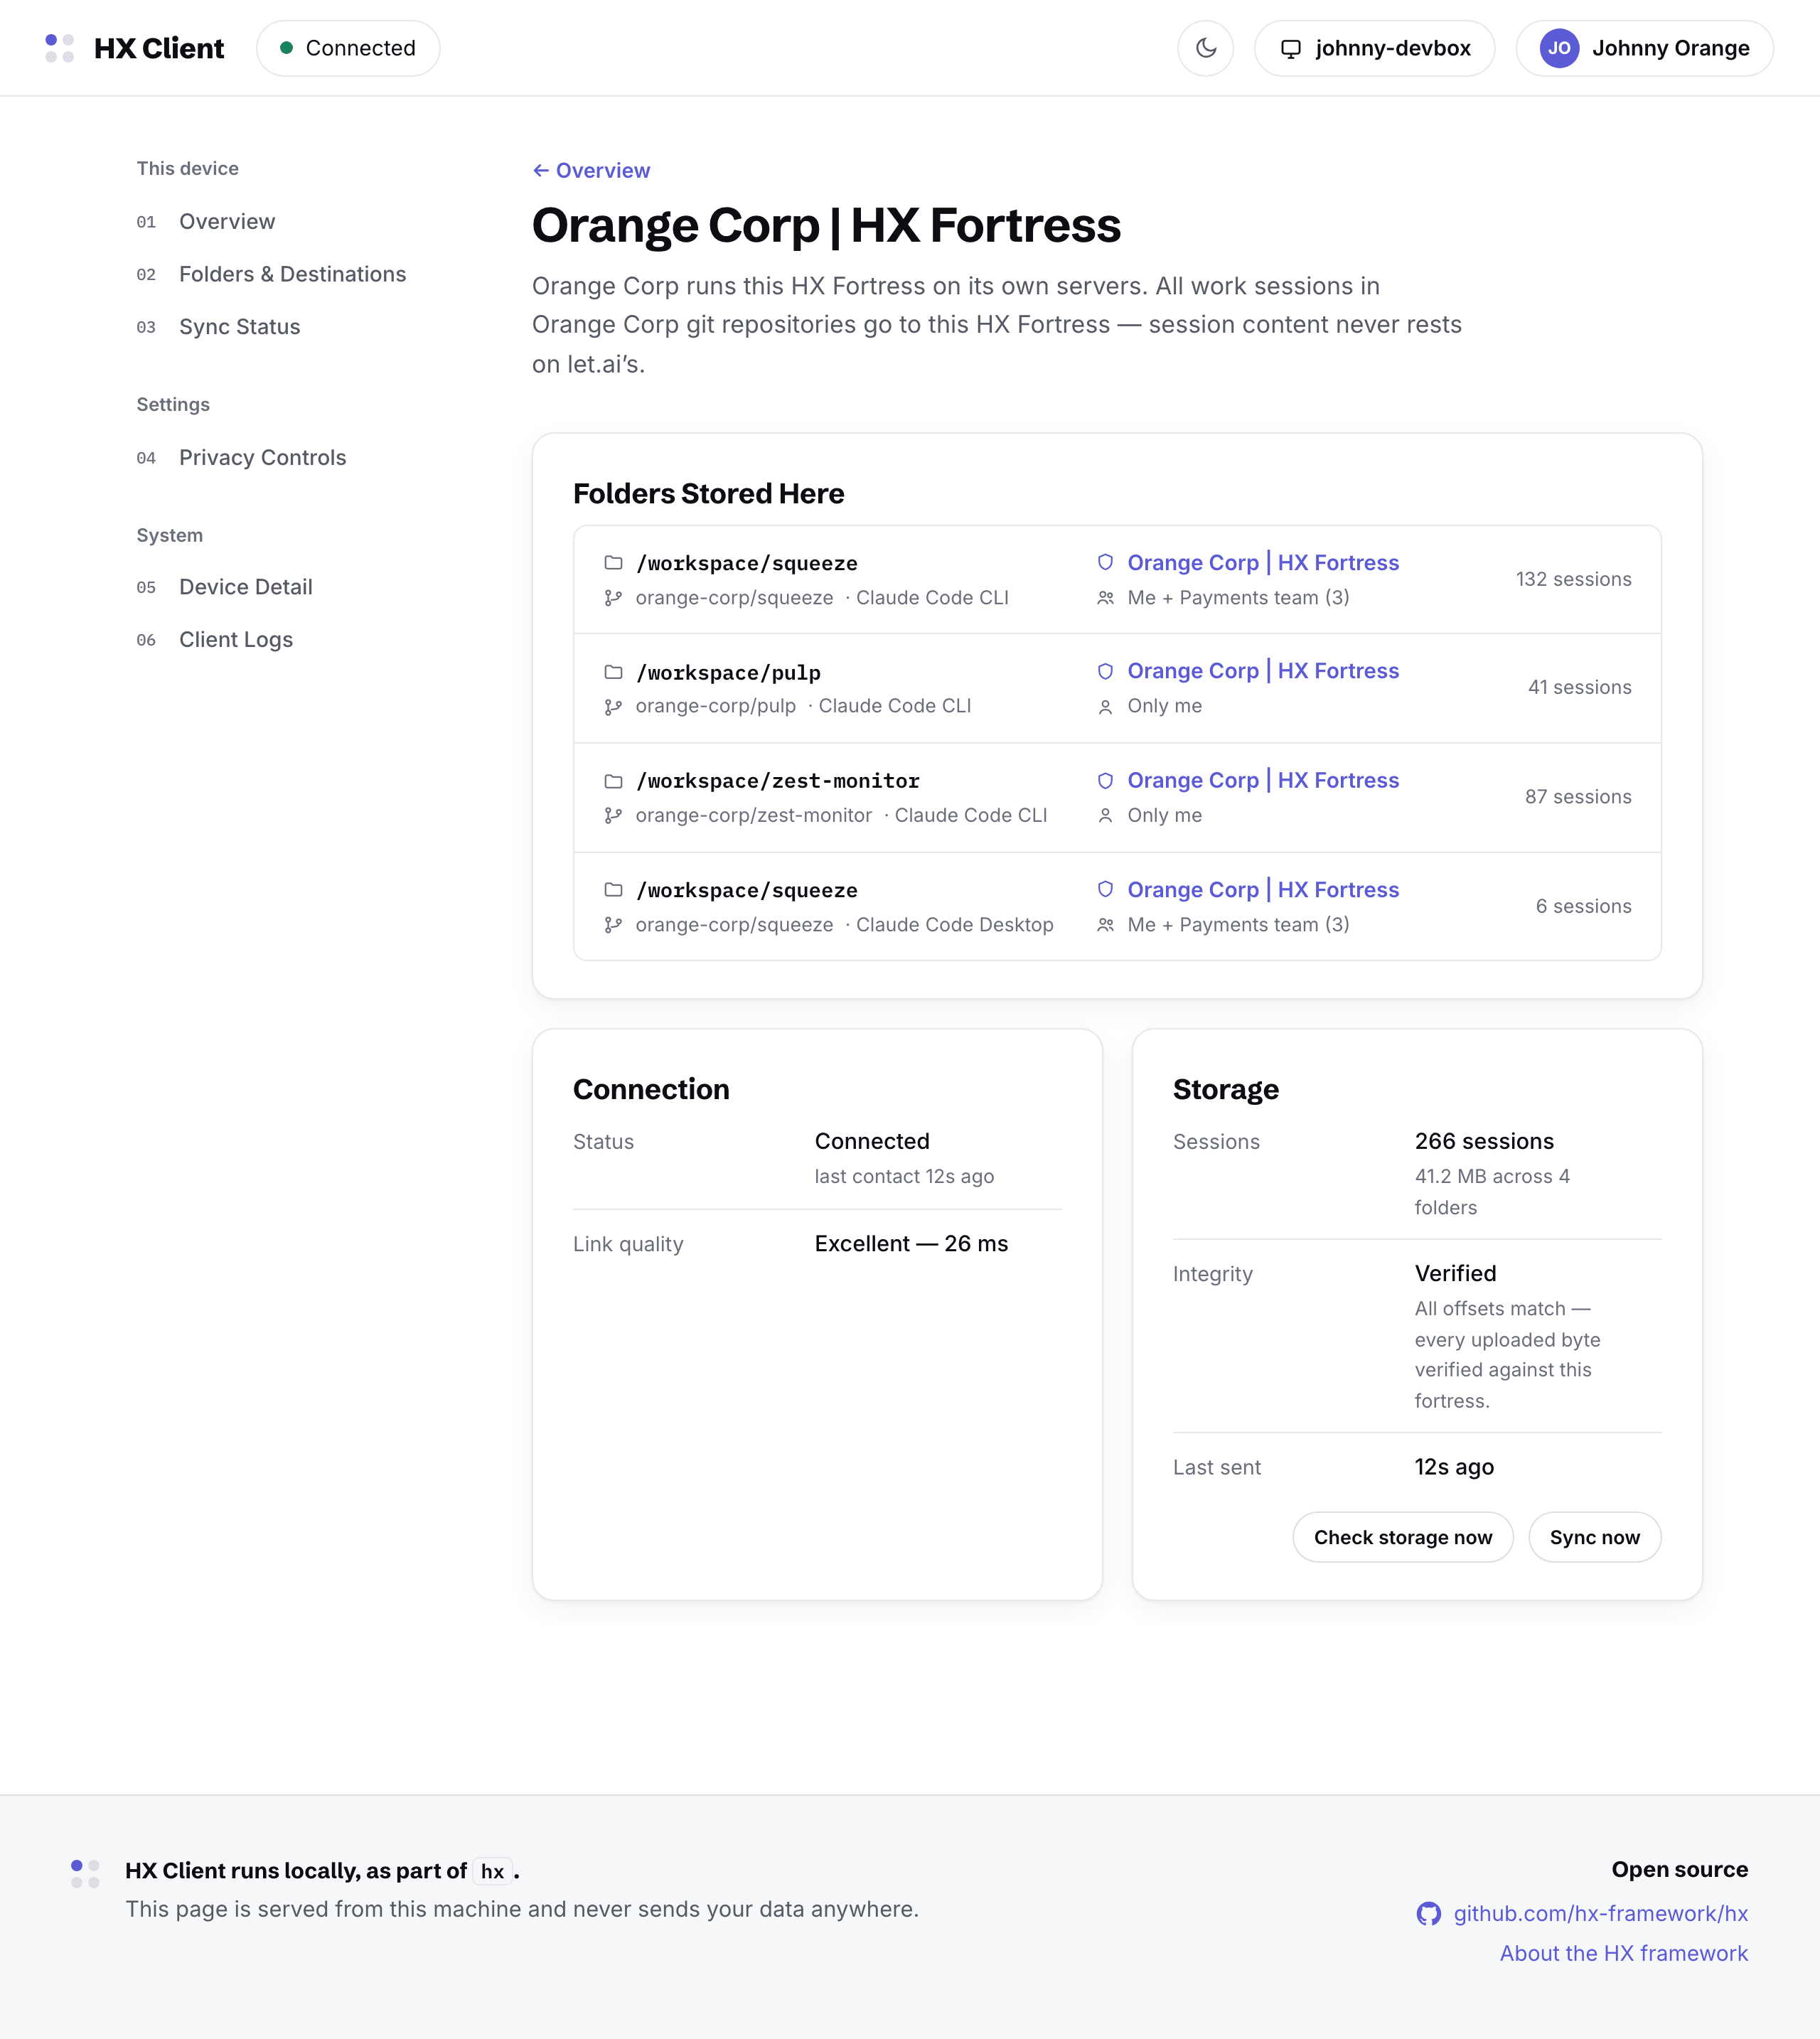
The Orange Corp fortress page: folders stored there, connection status, and storage integrity showing every uploaded byte verified
A company fortress, on company servers. Integrity: every uploaded byte verified against the store.
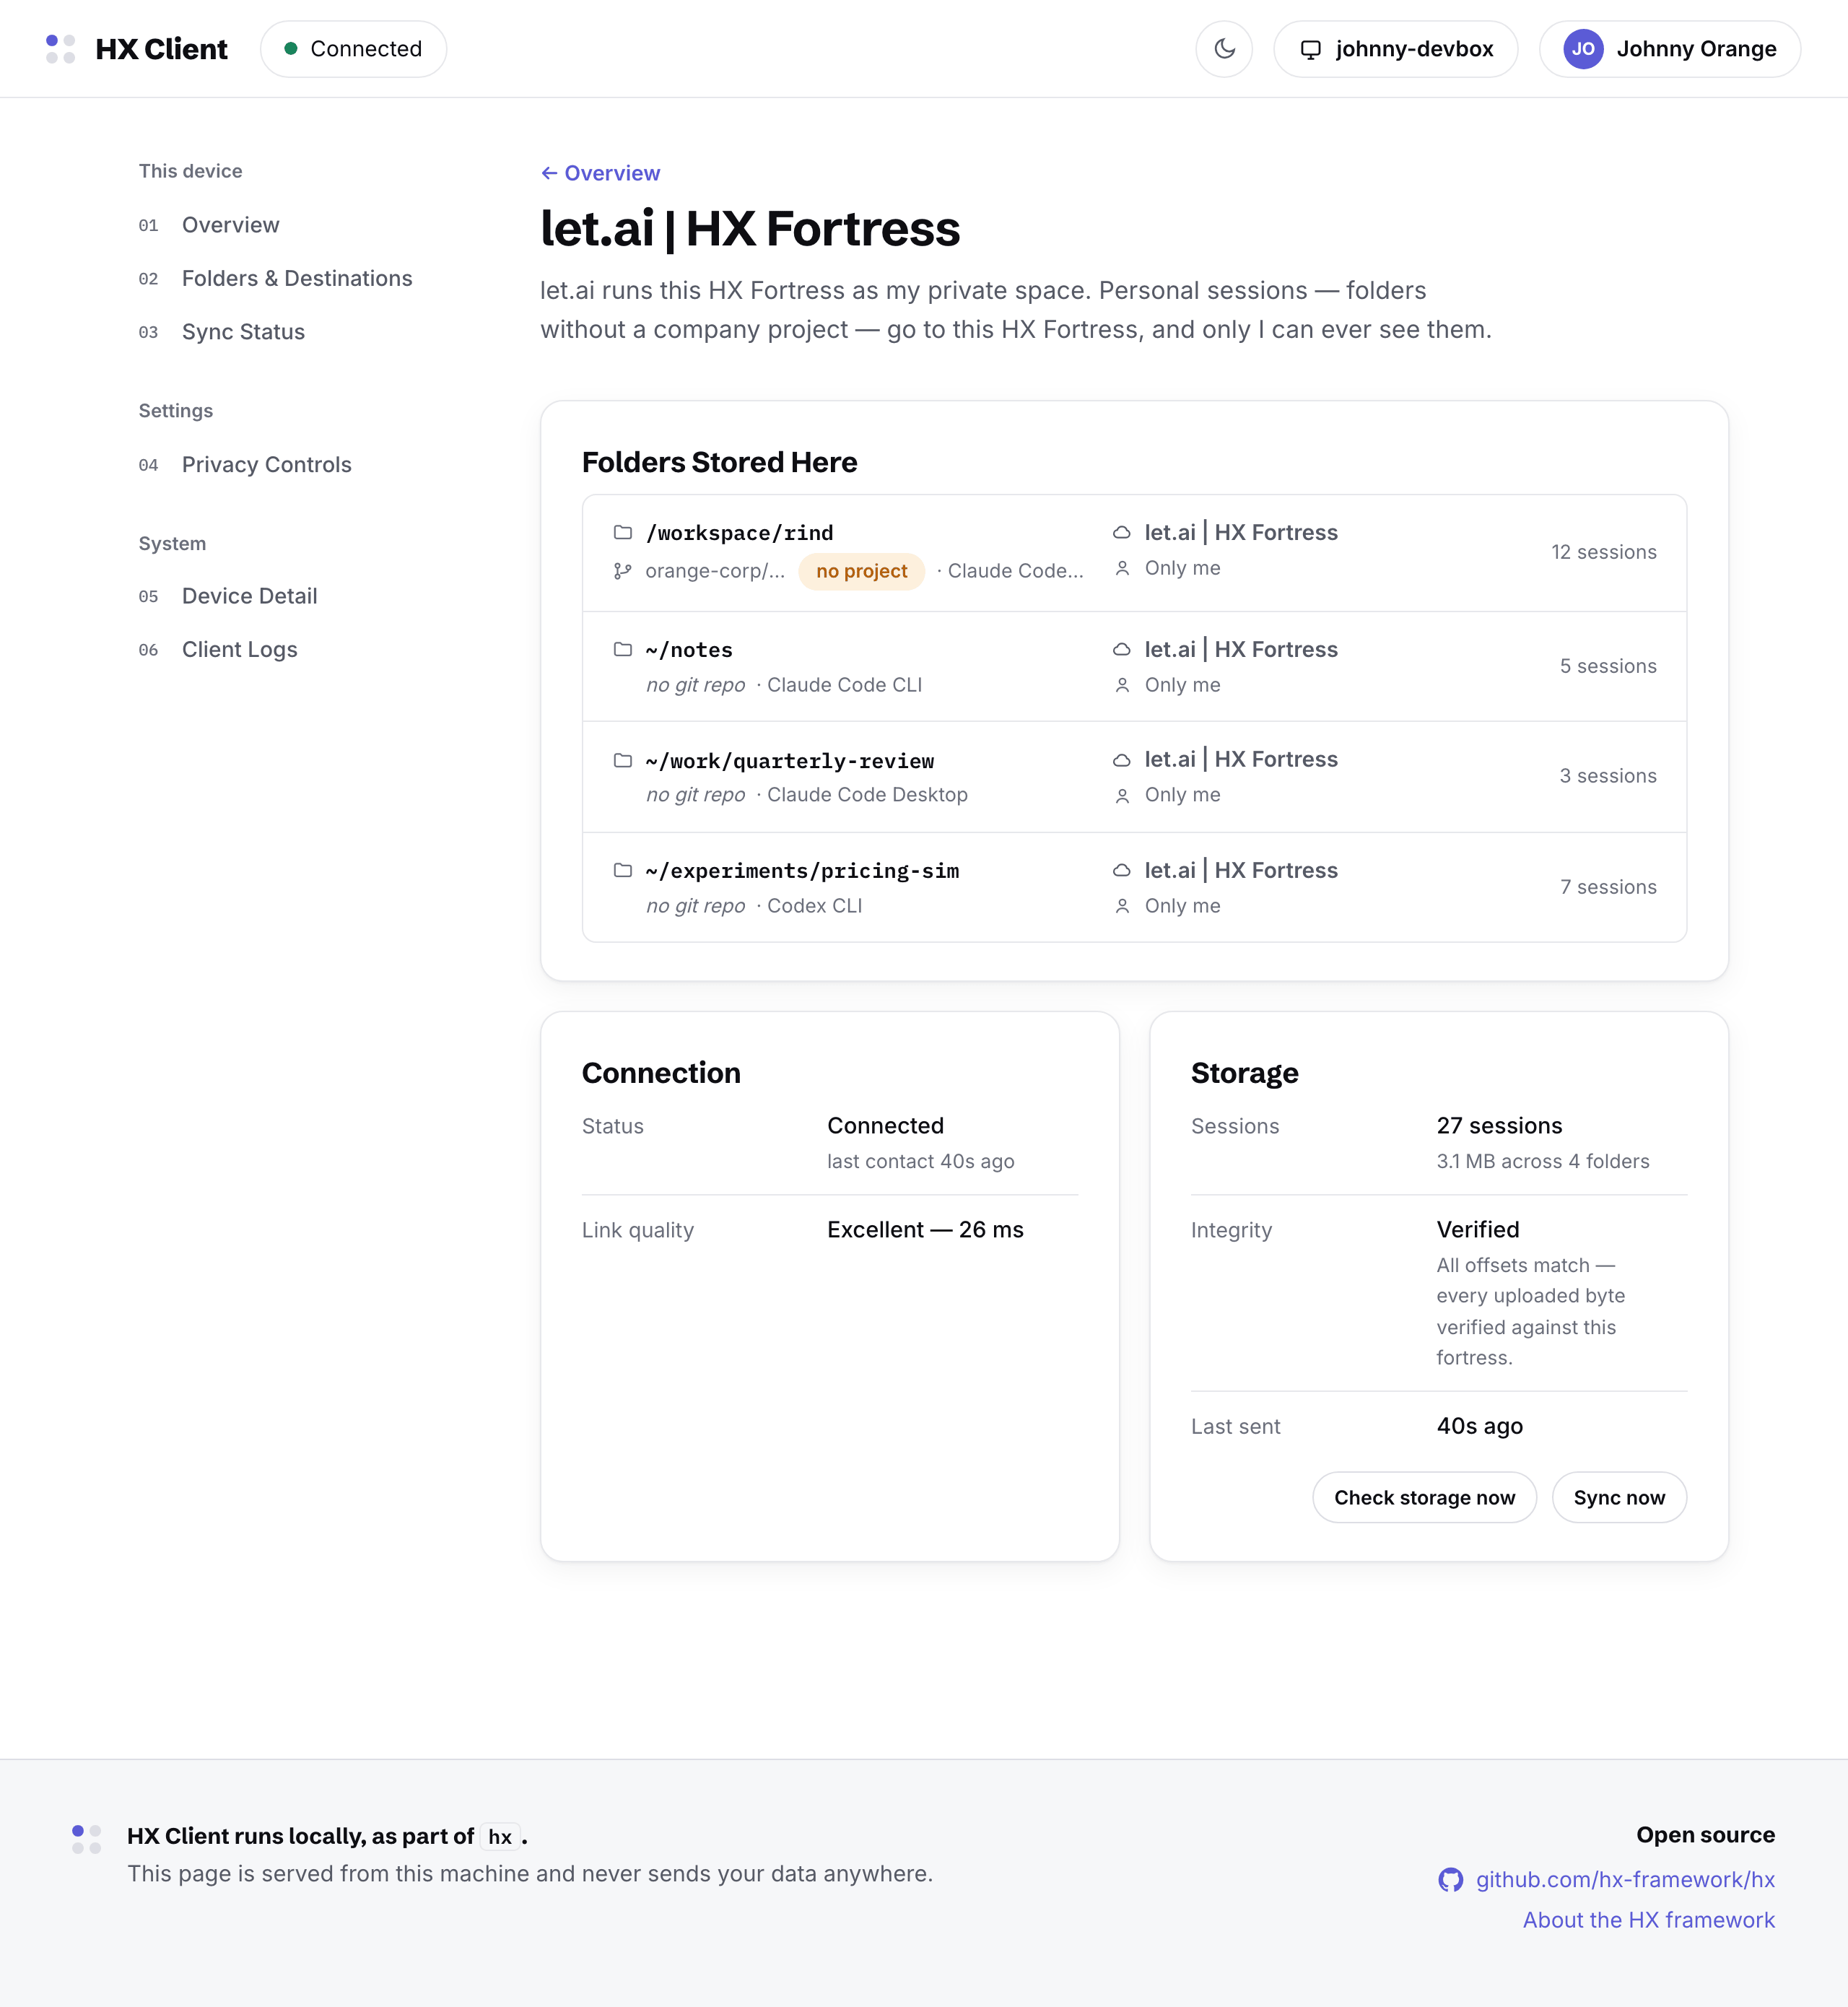
The personal space page: personal folders stored in a private space only its author can see
The personal space — sessions that belong to no company, readable by their author alone.
Appearance

Light and dark

The interface follows the system theme, with a manual switch in the top bar. Same layout, same numbers, either way.
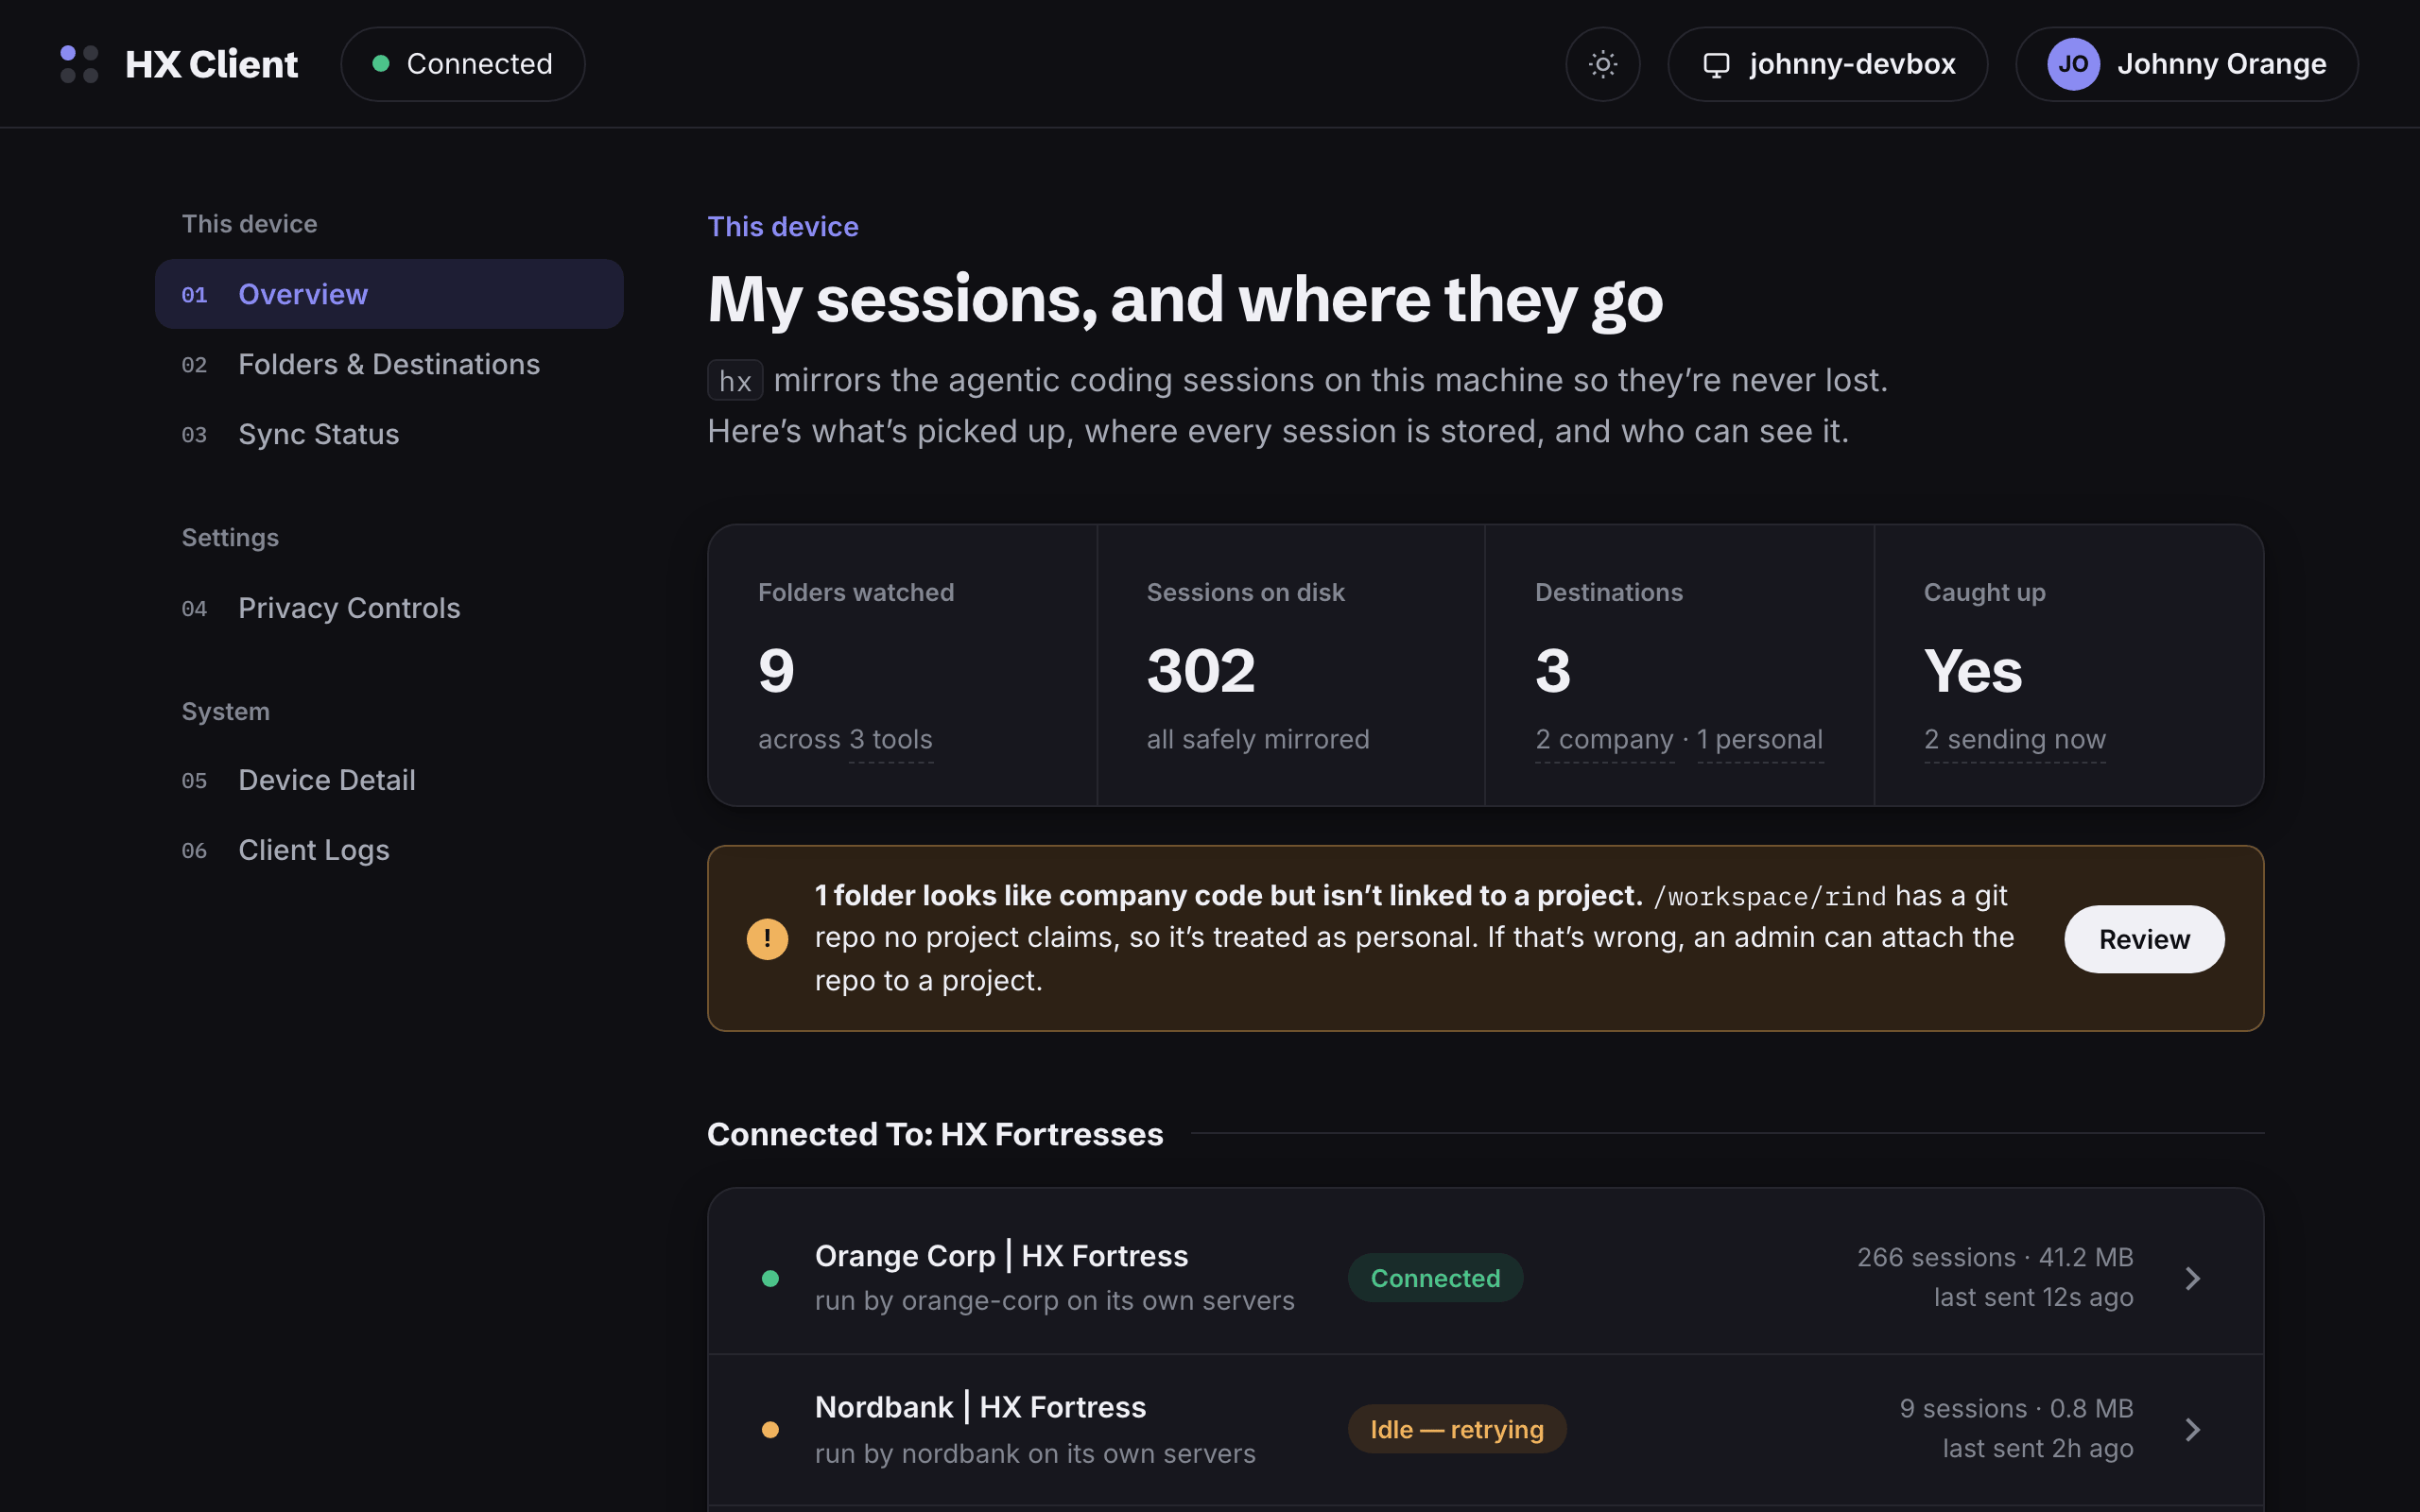
The overview screen in the dark theme
The What Leaves This Machine inspector in the dark theme